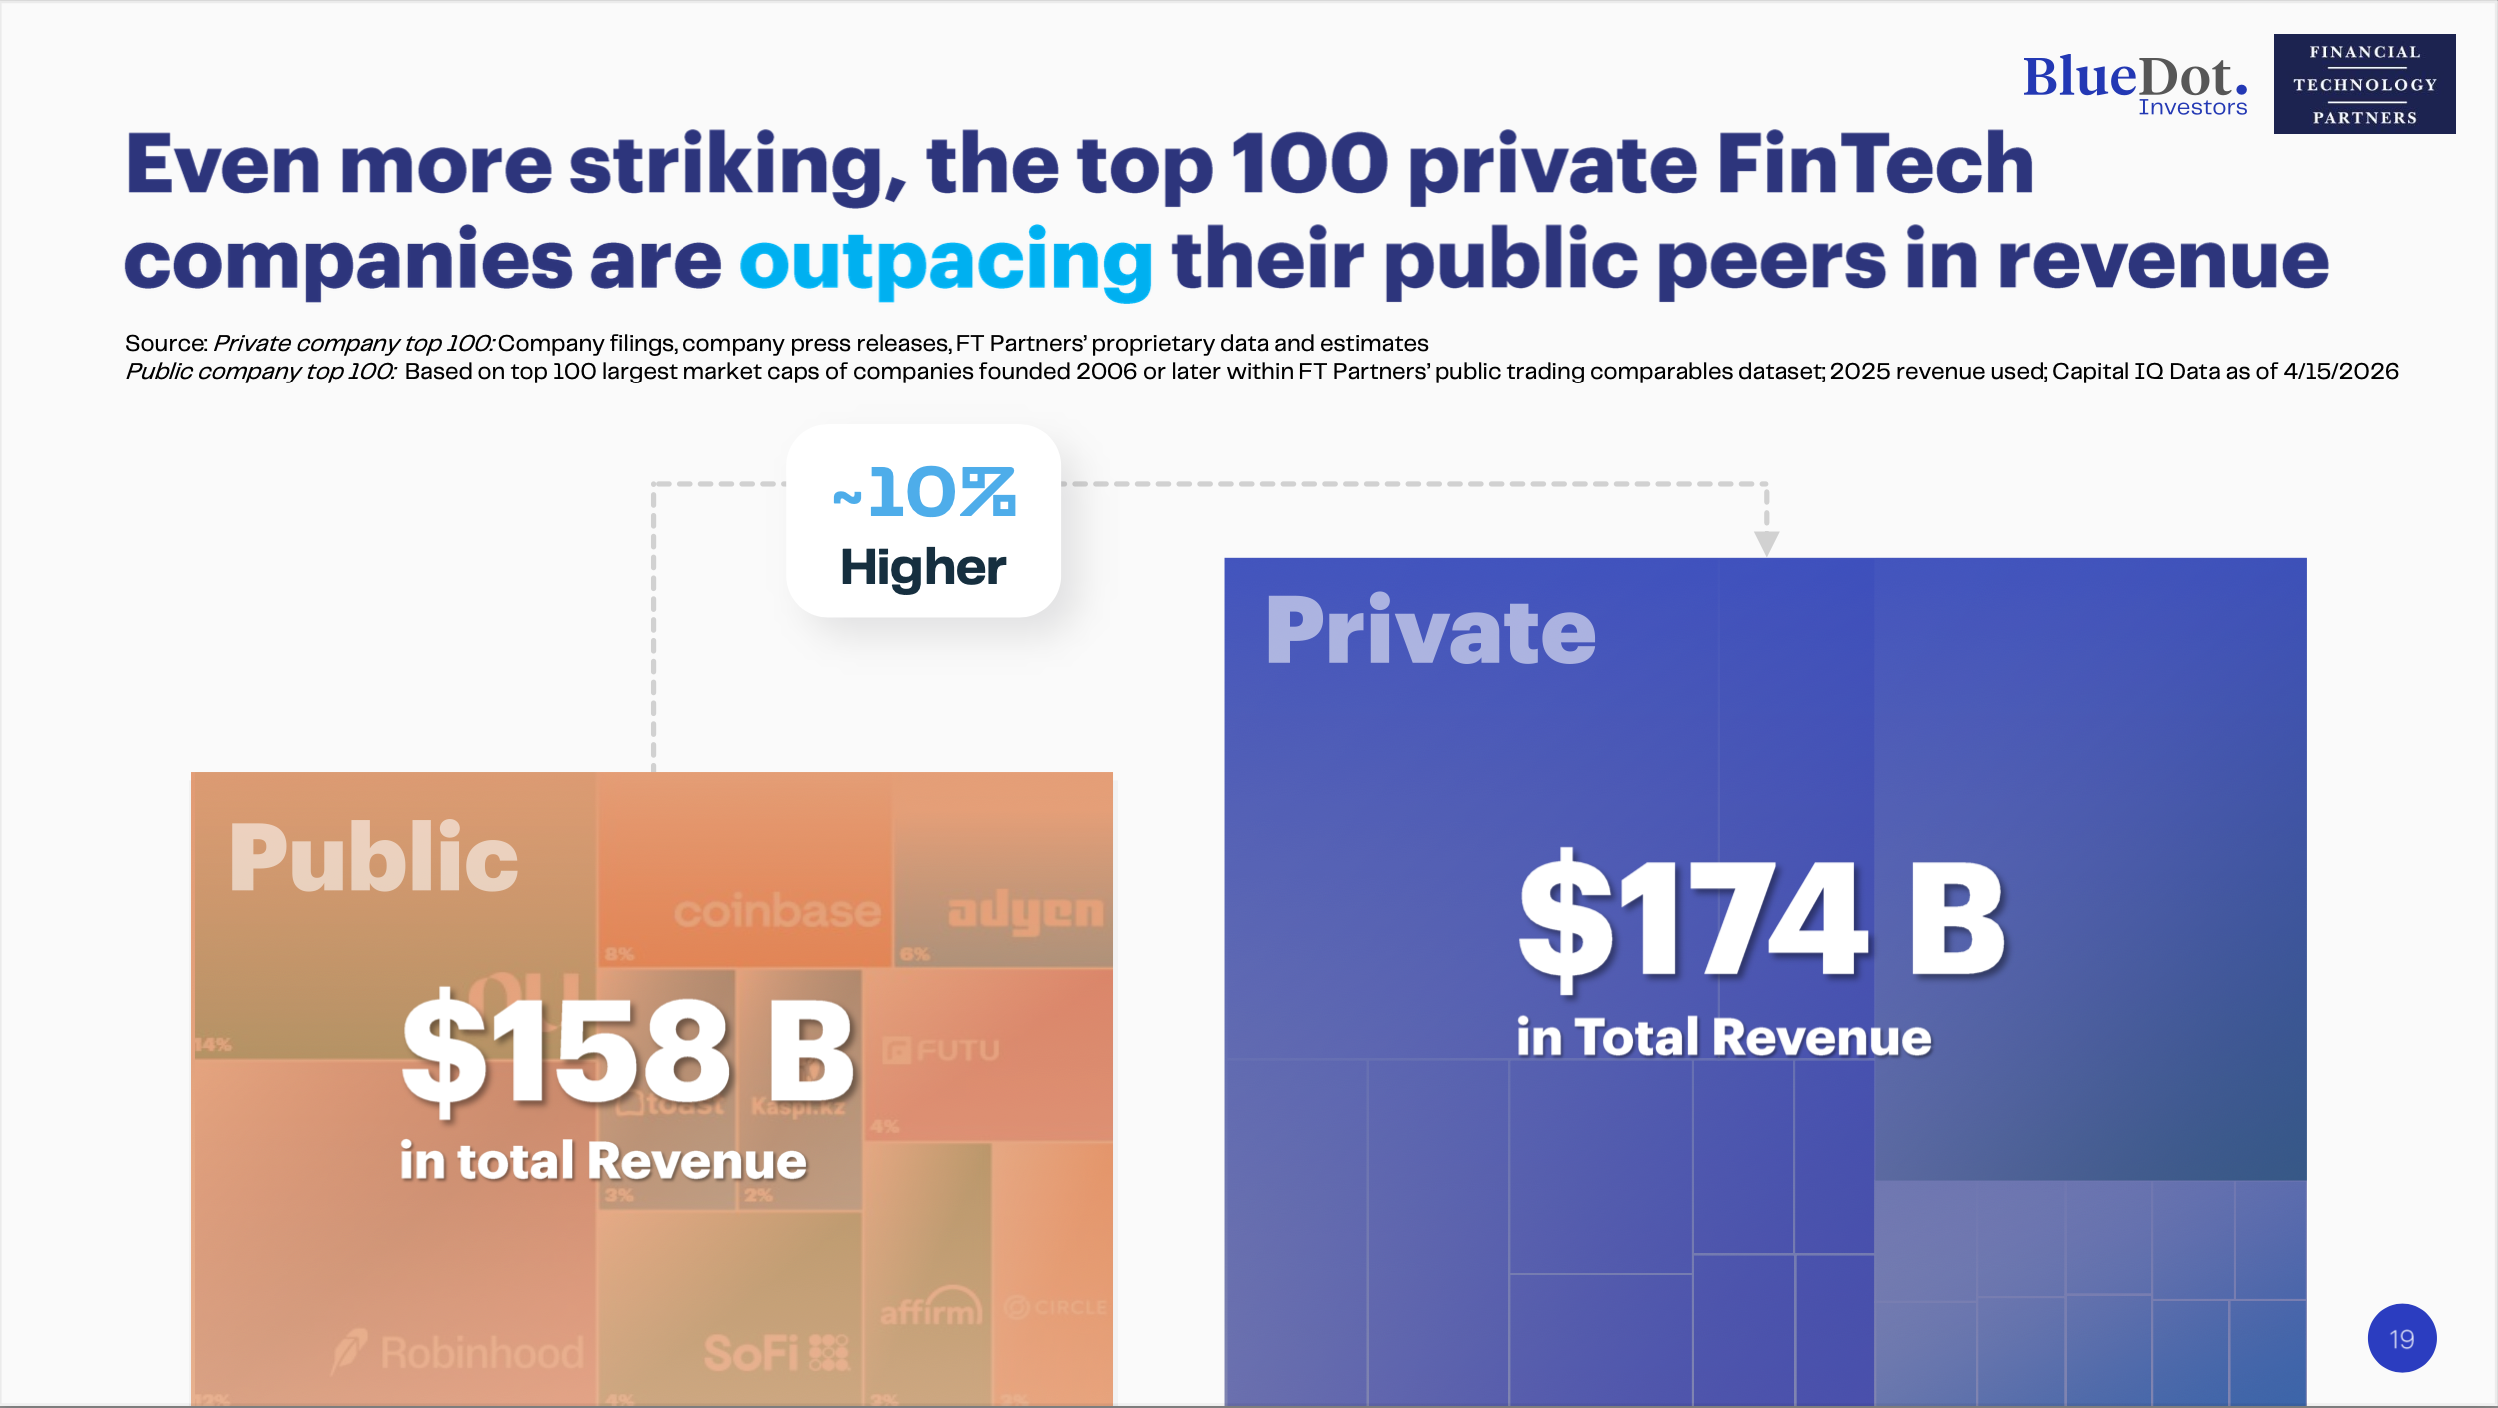
The top 100 private FinTech companies are outpacing their public peers in revenue
Source: Private company top 100: Company filings, company press releases, FT Partners' proprietary data and estimates
Public company top 100: Based on top 100 largest market caps of companies founded 2006 or later within FT Partners' public trading comparables dataset; 2025 revenue used; Capital IQ Data as of 4/15/2026
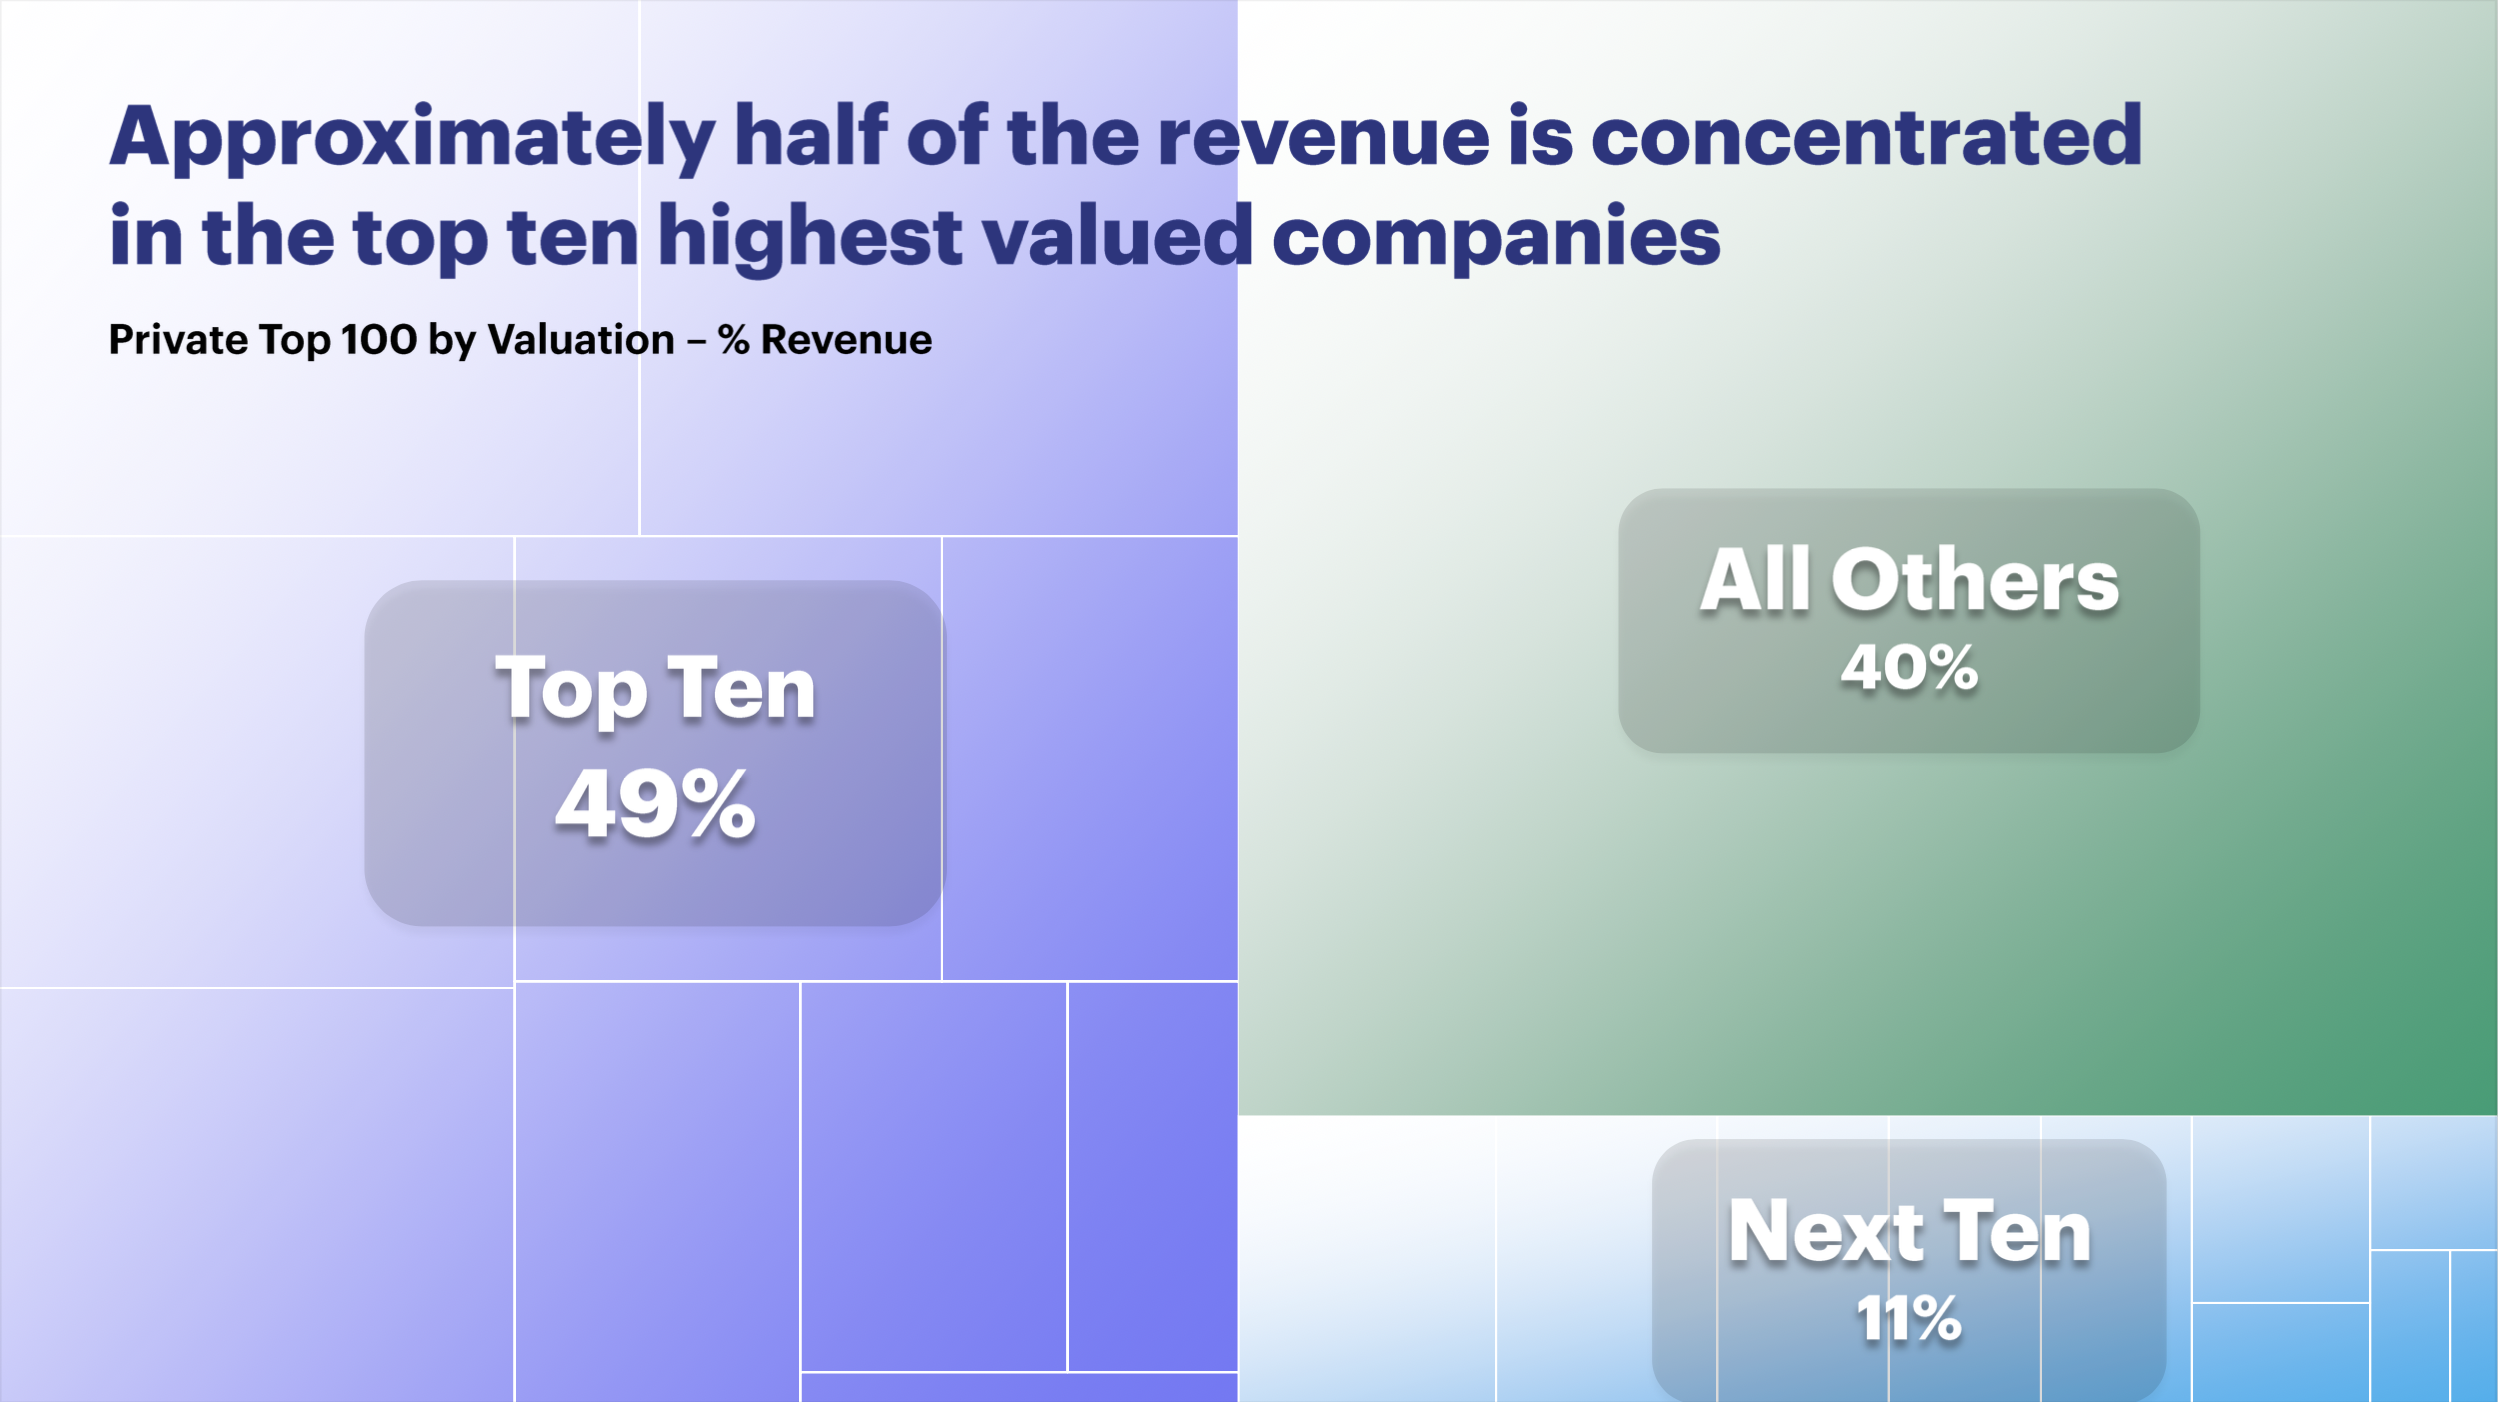
Approximately half of the revenue is concentrated in the top ten highest valued companies
Private Top 100 by Valuation – % Revenue
Source: Company filings, company press releases, public news, FT Partners' proprietary data and estimates
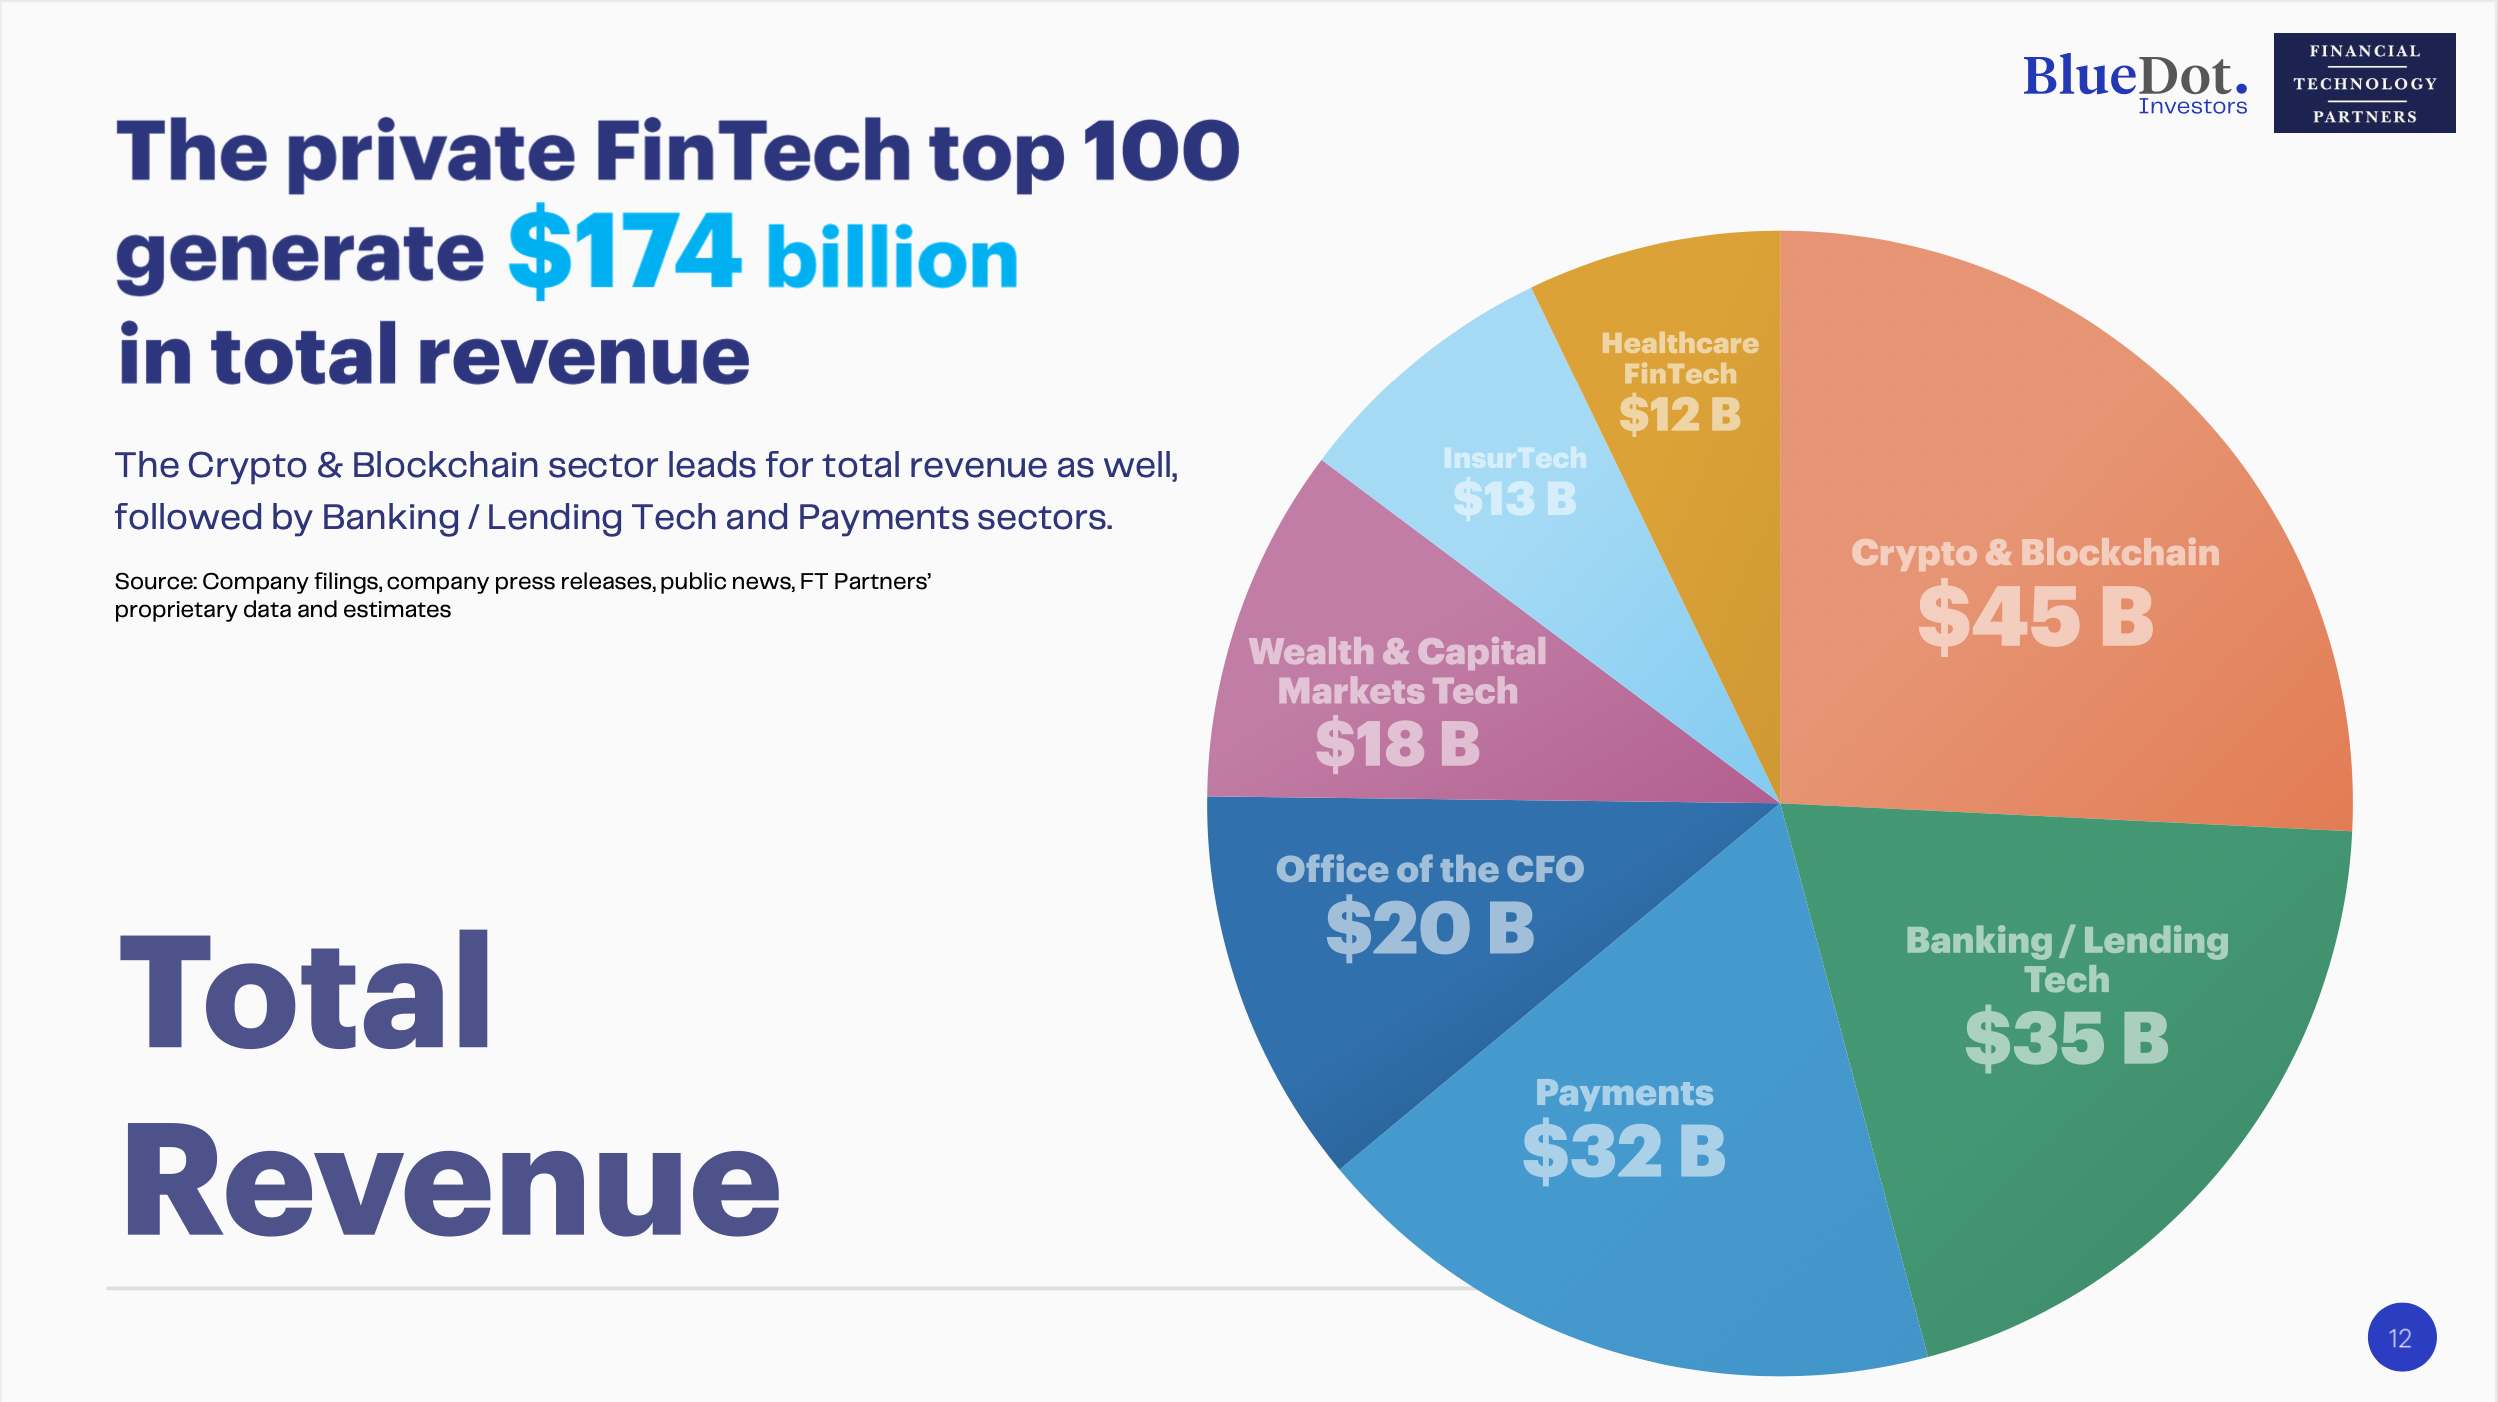
The private FinTech top 100 generate $174 billion in total revenue
The Crypto & Blockchain sector leads for total revenue as well, followed by Banking / Lending Tech and Payments sectors.
Source: Company filings, company press releases, public news, FT Partners' proprietary data and estimates
The private FinTech top 100 represents $1.9 trillion in total valuation
Some of the largest private FinTech companies in the world are Crypto & Blockchain players, with the sector handily ranking in the top spot for valuation.
Source: Company press releases, public news, FT Partners' proprietary data and estimates
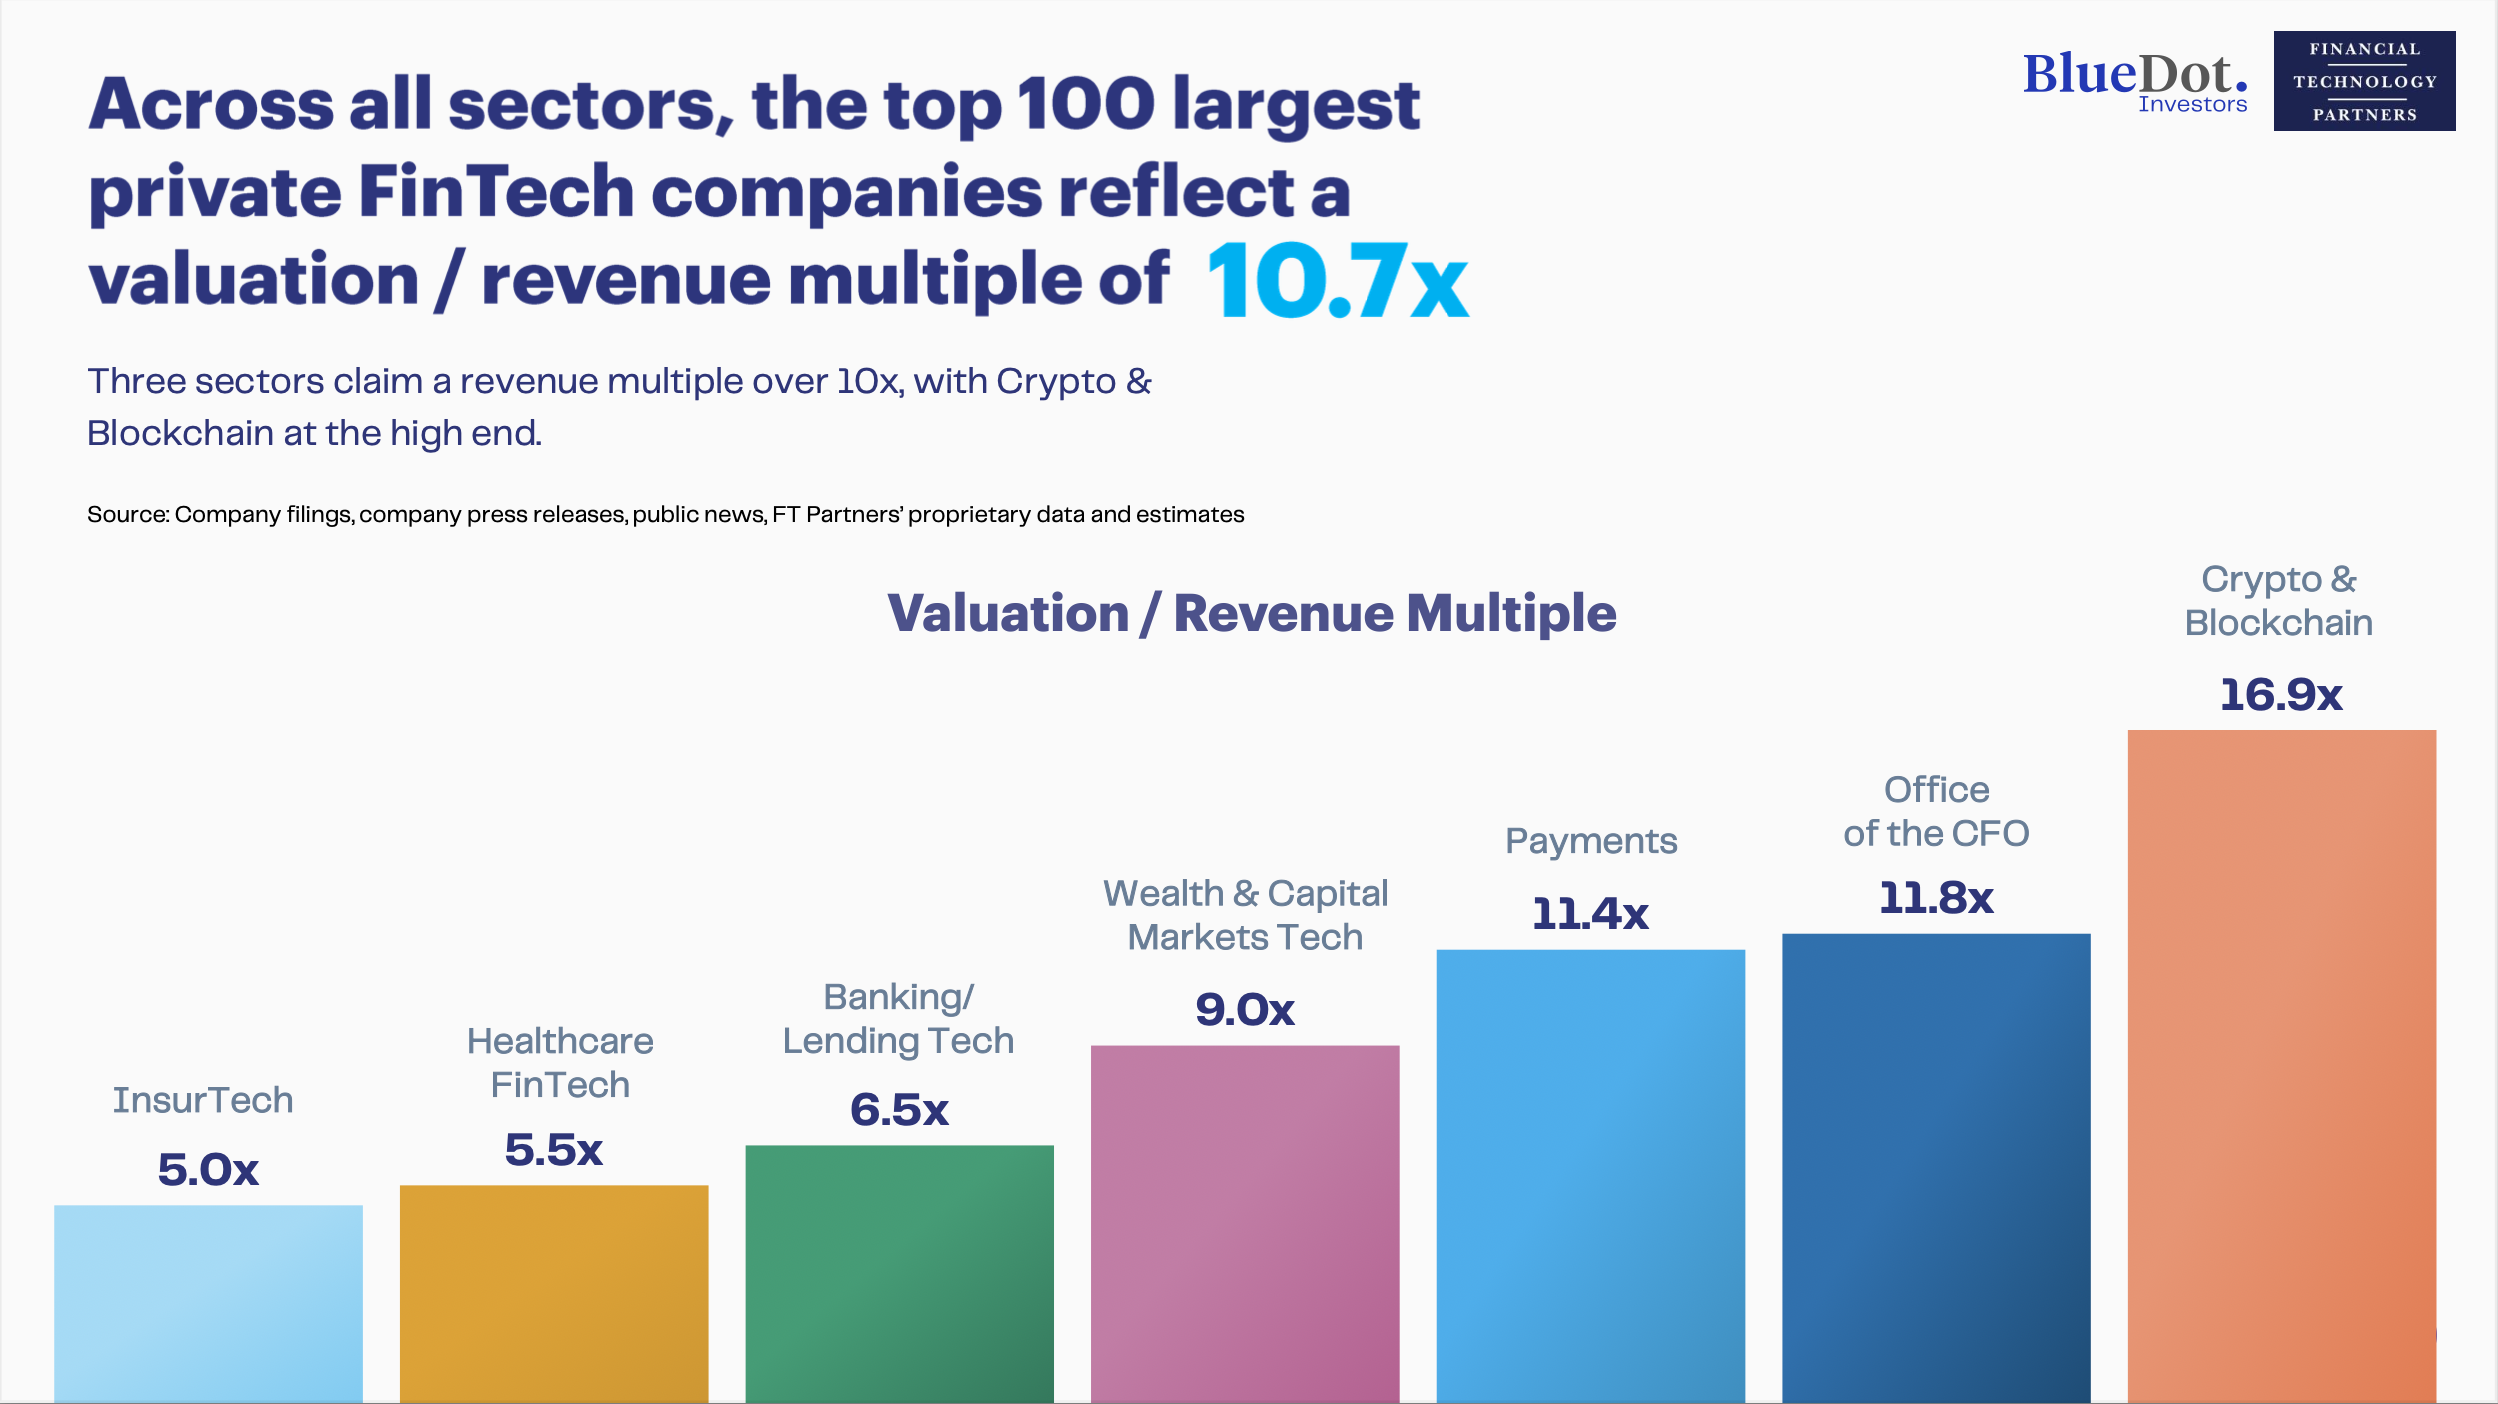
Across all sectors, the top 100 largest private FinTech companies reflect a valuation / revenue multiple of 10.7x
Three sectors claim a revenue multiple over 10x, with Crypto & Blockchain at the high end.
Source: Company filings, company press releases, public news, FT Partners' proprietary data and estimates
Valuation / Revenue Multiple
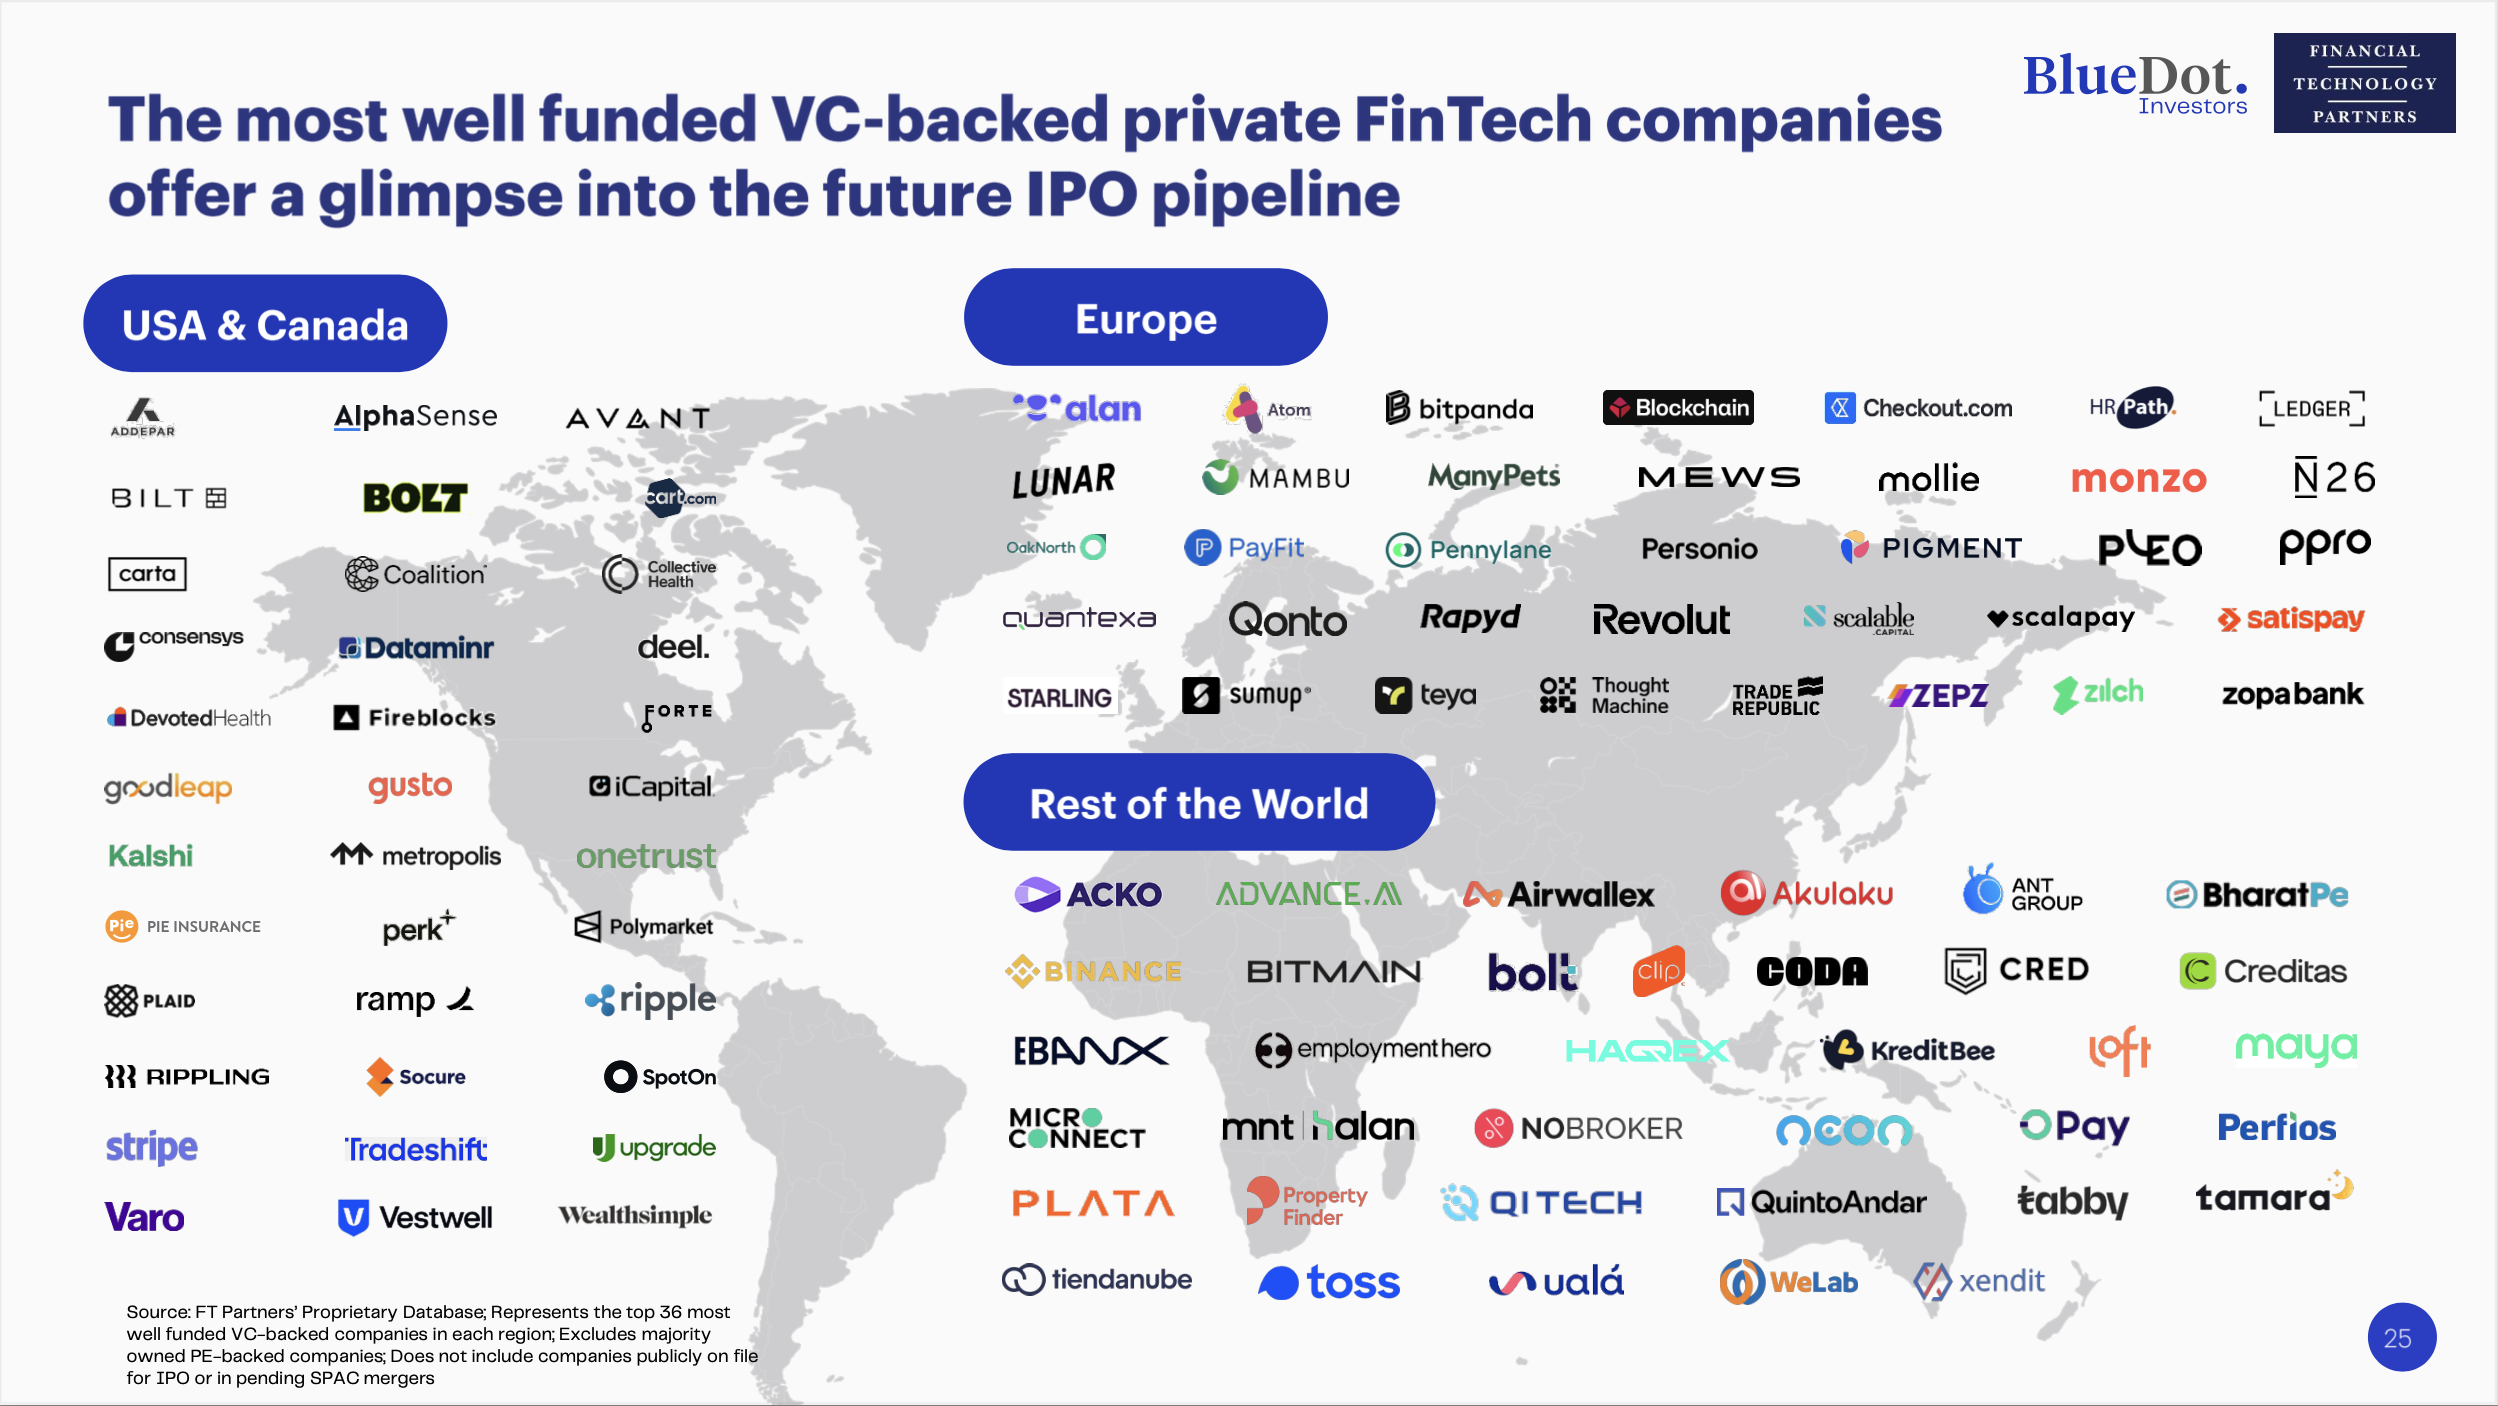
The most well funded VC-backed private FinTech companies


Source: FT Partners' Proprietary Database; Represents the top 36 most well funded VC-backed companies in each region; Excludes majority owned PE-backed companies; Does not include companies publicly on file for IPO or in pending SPAC mergers.
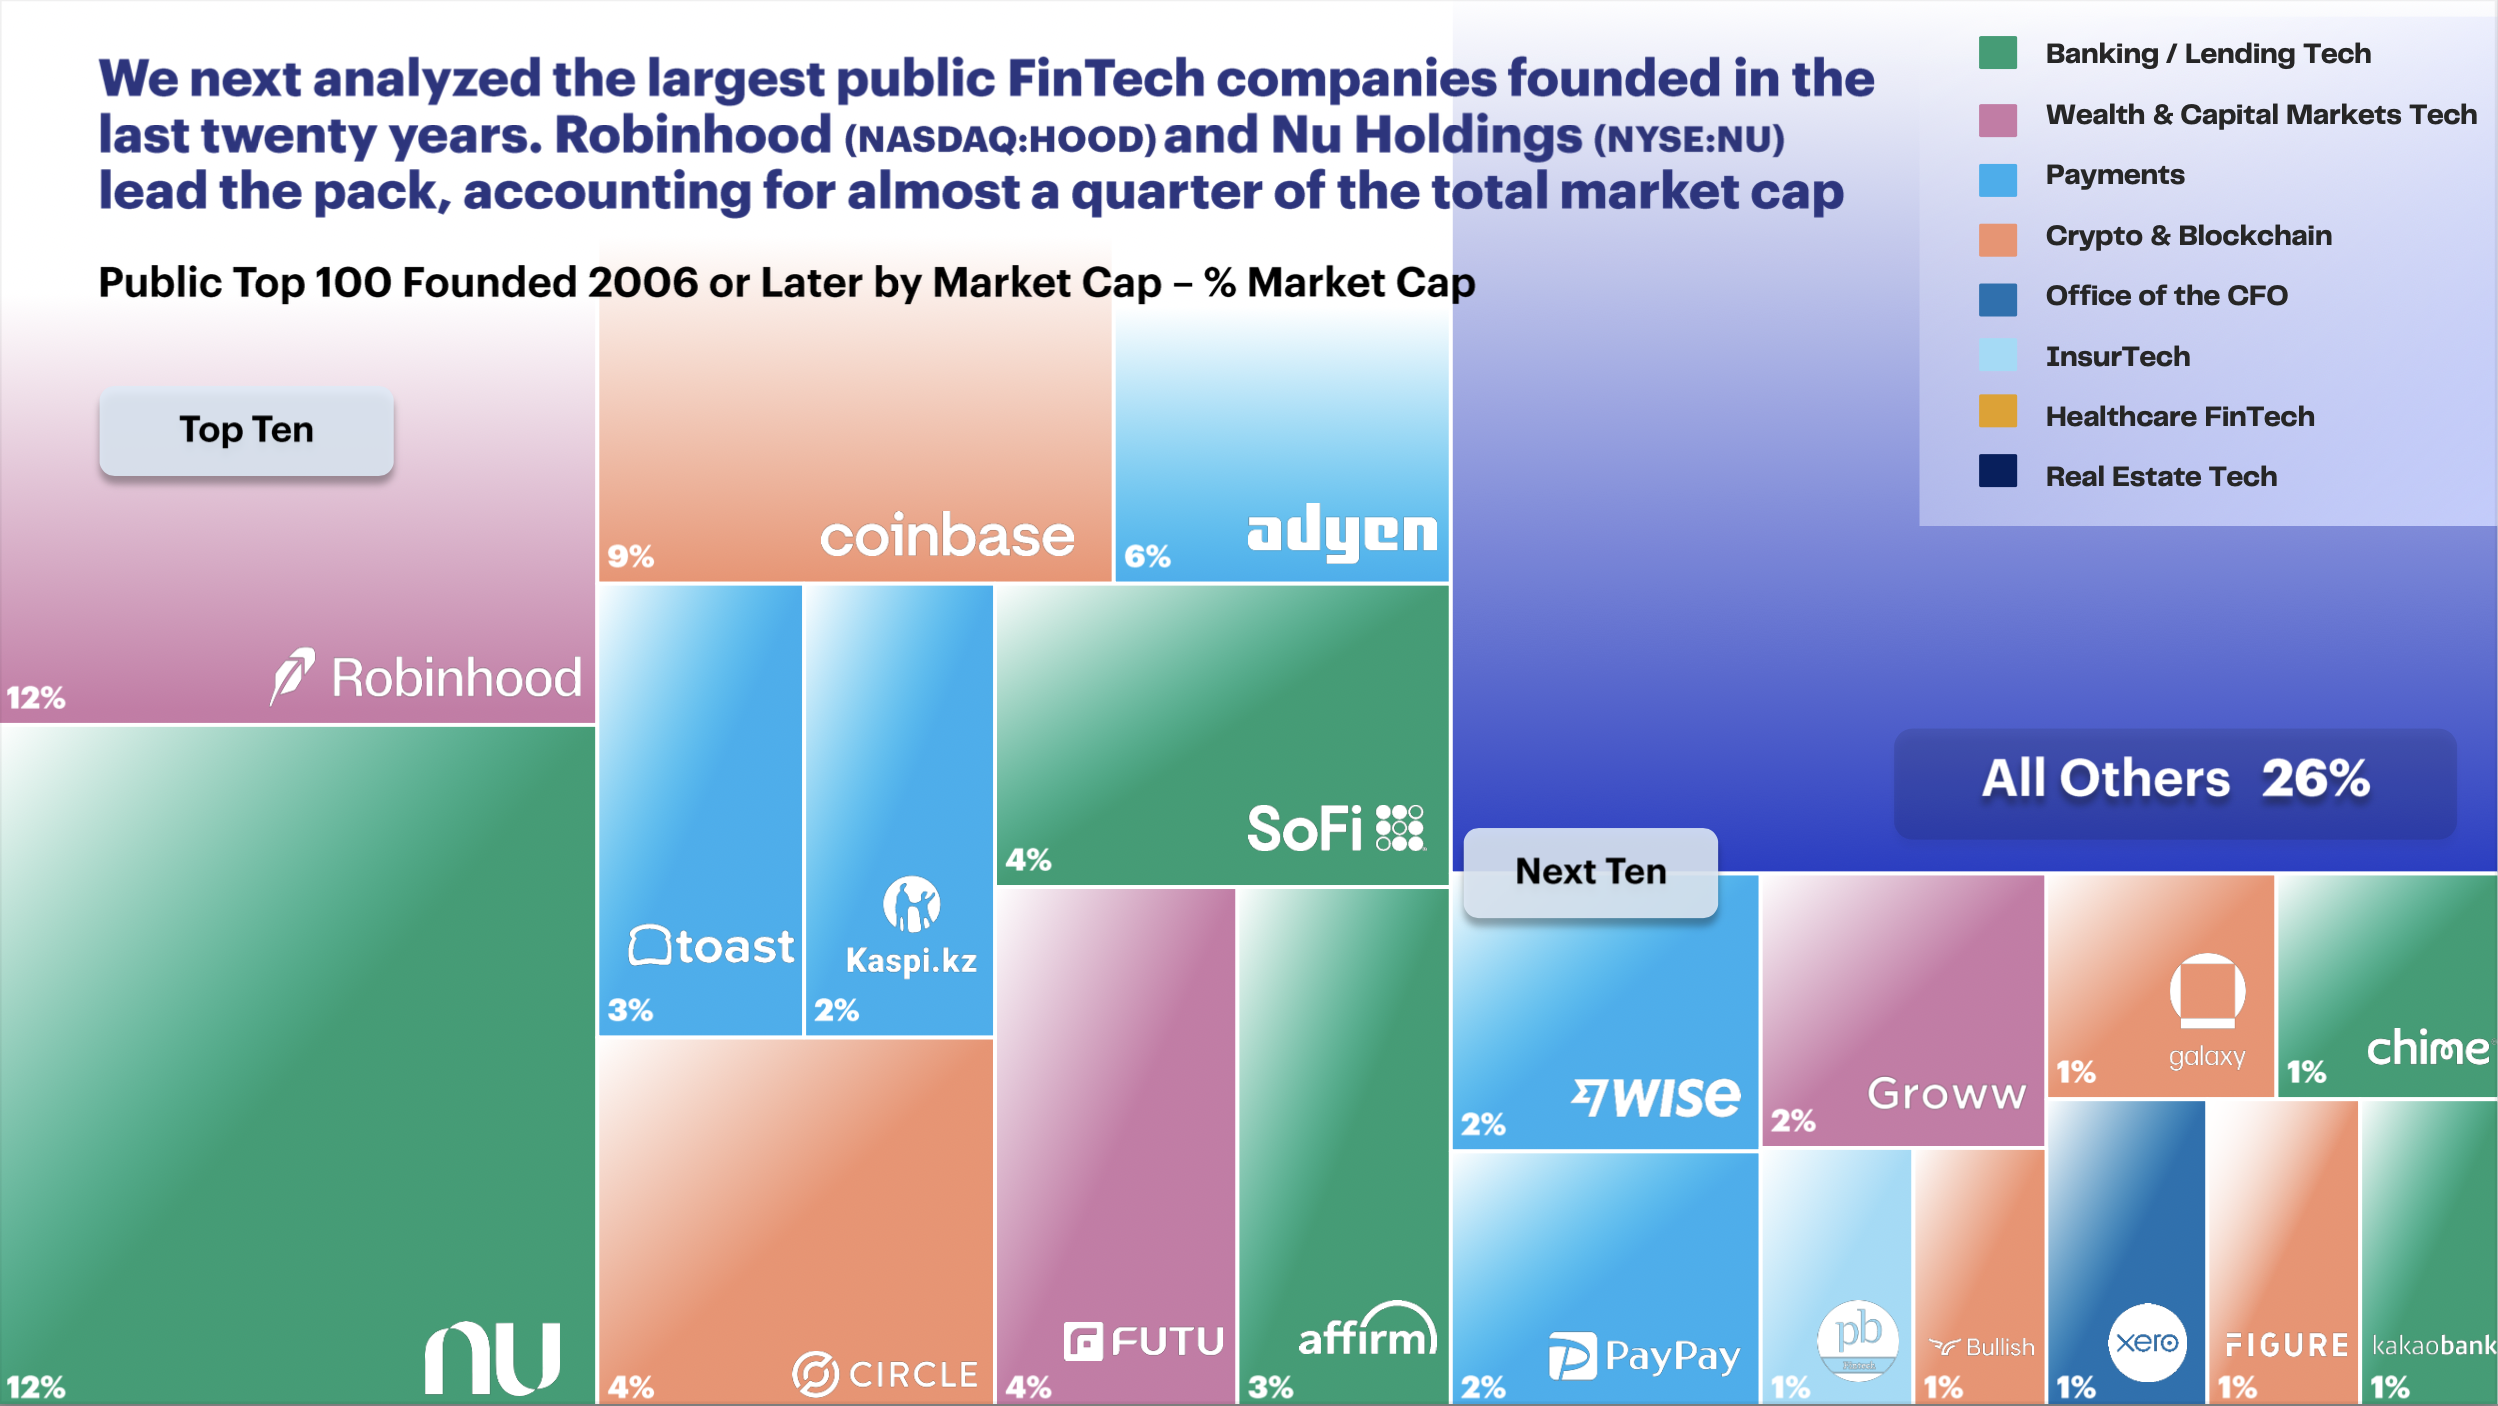
The largest public FinTech companies founded in the last twenty years. Robinhood (NASDAQ:HOOD) and Nu Holdings (NYSE:NU) lead the pack, accounting for almost a quarter of the total market cap
Public Top 100 Founded 2006 or Later by Market Cap – % Market Cap
All Others
26%


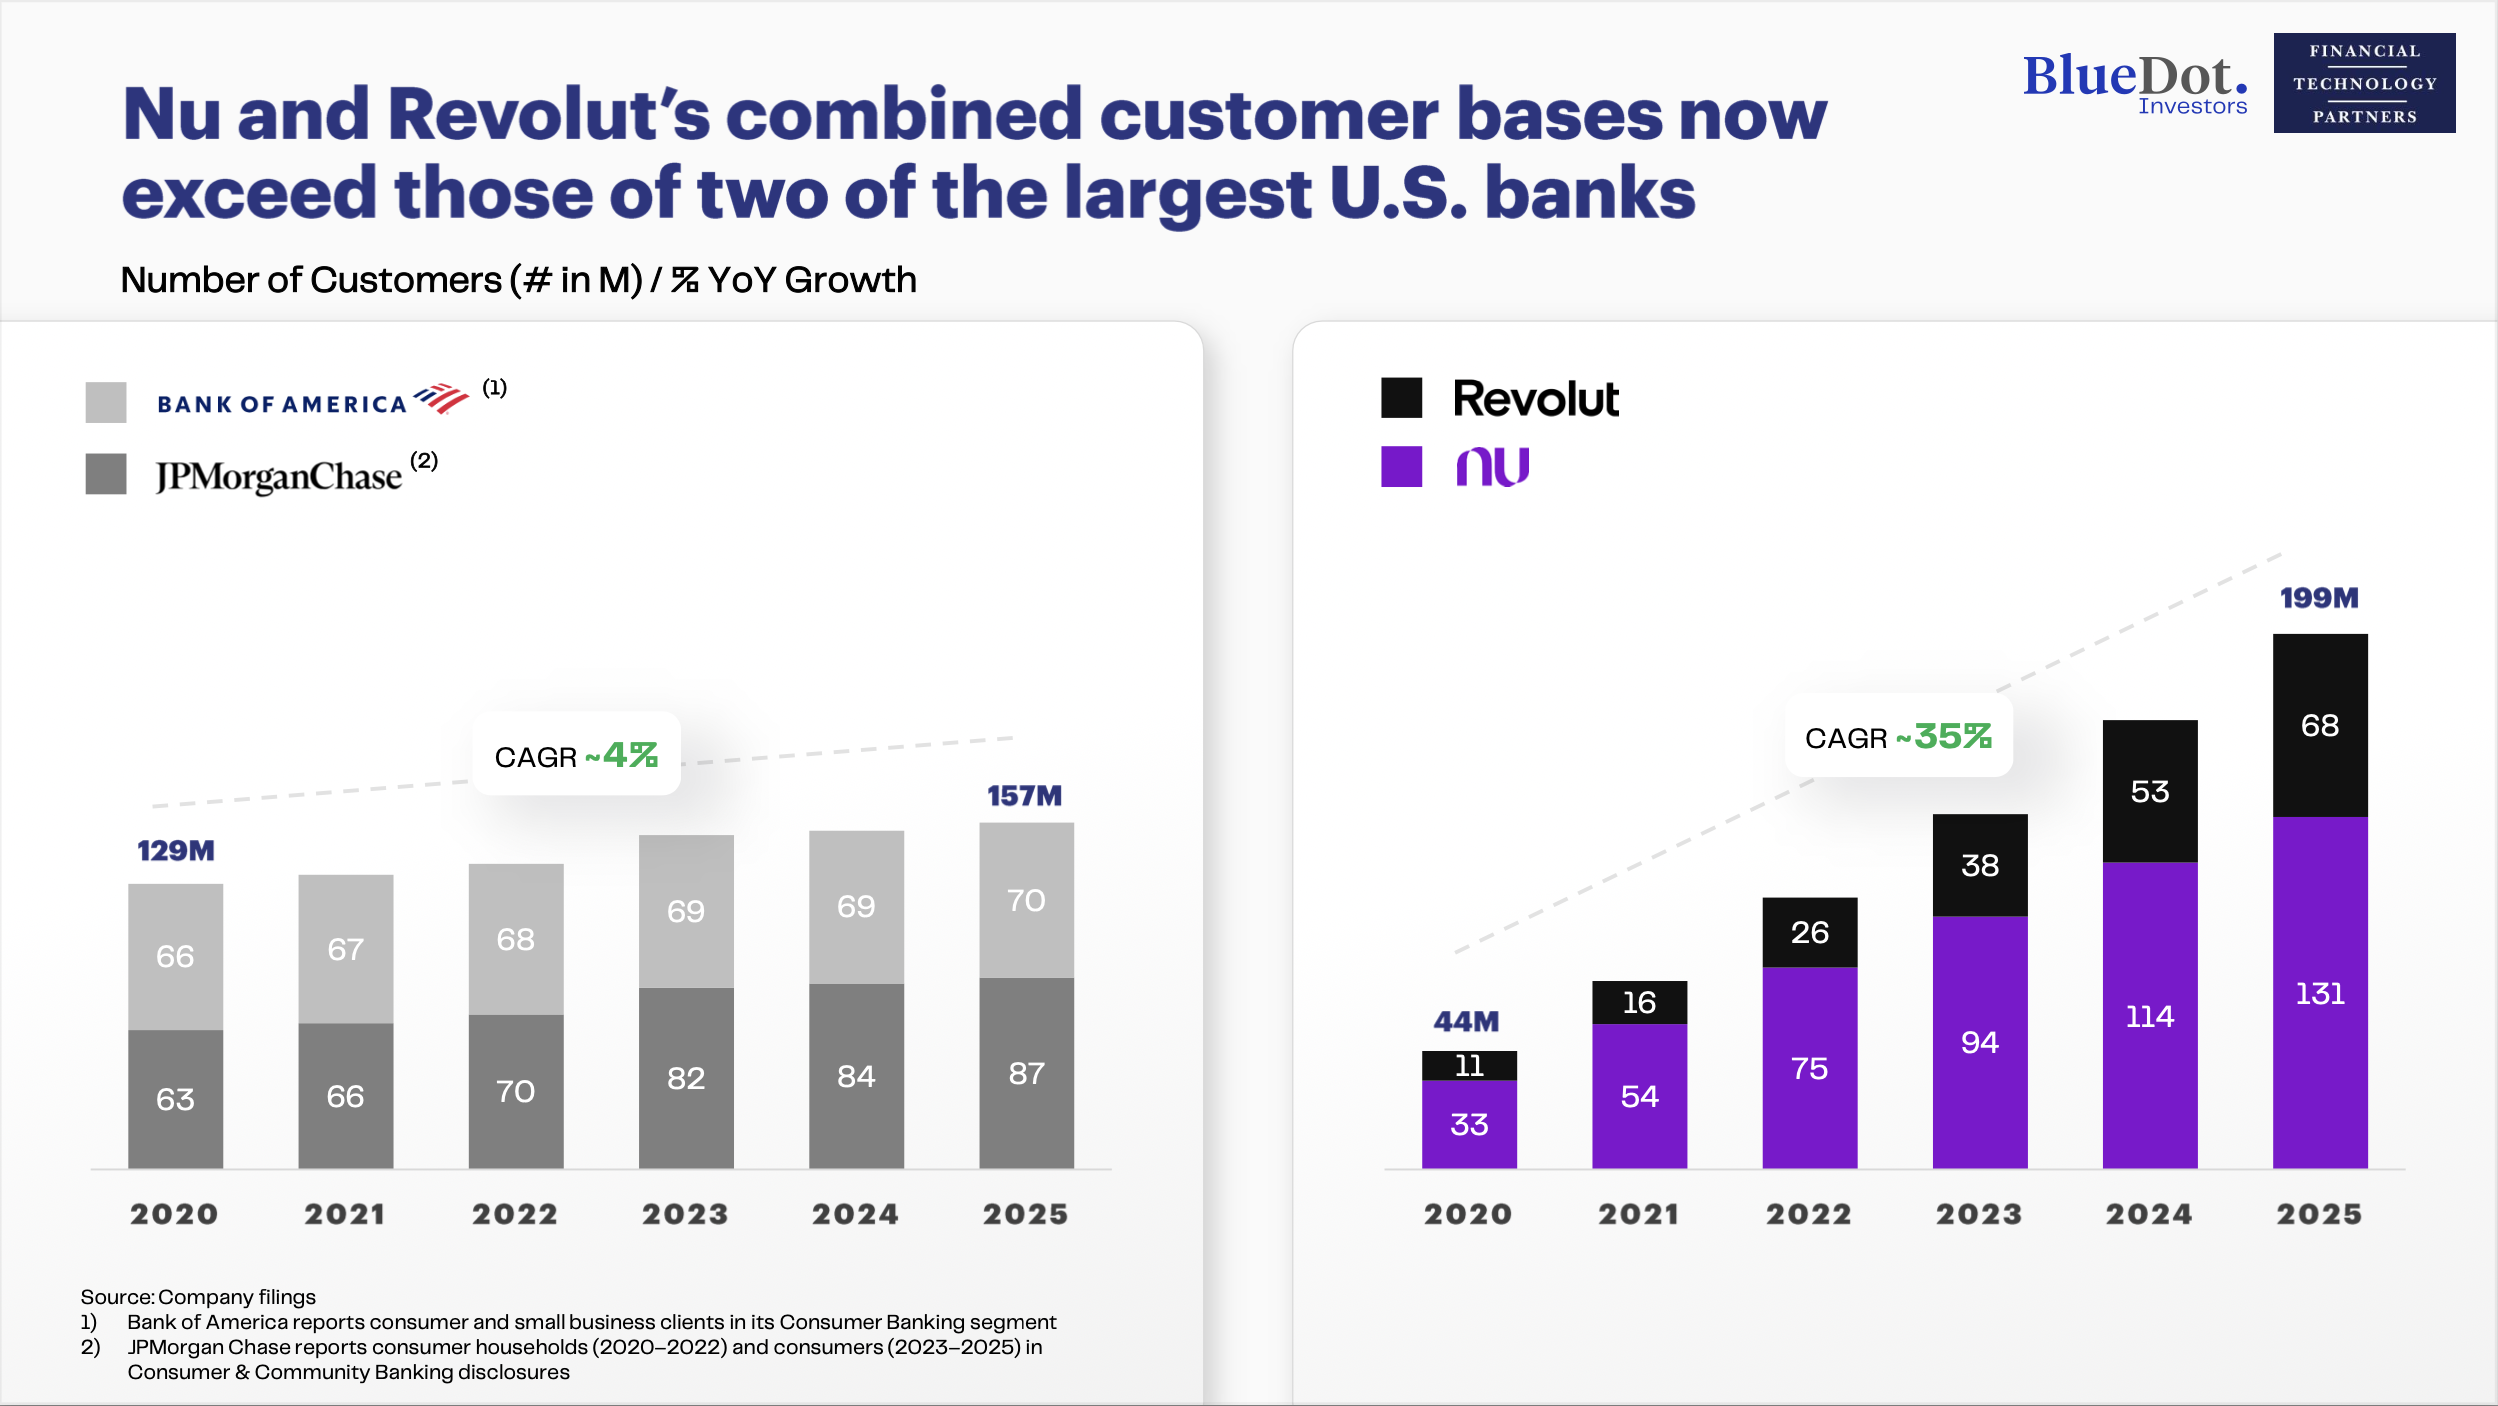
Nu and Revolut's combined customer bases now exceed those of two of the largest U.S. banks
Number of Customers (# in M) / % YoY Growth
Source: Company filings
1) Bank of America reports consumer and small business clients in its Consumer Banking segment.
2) JPMorgan Chase reports consumer households (2020–2022) and consumers (2023–2025) in Consumer & Community Banking disclosures.
The IPO window for FinTech has finally re-opened
Source: FT Partners' Proprietary Database
Note: Only includes US-listed IPOs that raised $30 million or more in gross proceeds

$880 M
Gross Proceeds

$213 M
Gross Proceeds

$368 M
Gross Proceeds

$345 M
Gross Proceeds

$864 M
Gross Proceeds

$240 M
Gross Proceeds

$485 M
Gross Proceeds

$425 M
Gross Proceeds

$1,110 M
Gross Proceeds

$1,054 M
Gross Proceeds

$434 M
Gross Proceeds

$168 M
Gross Proceeds

$788 M
Gross Proceeds

$724 M
Gross Proceeds

$620 M
Gross Proceeds

$200 M
Gross Proceeds

$923 M
Gross Proceeds

$1,372 M
Gross Proceeds

$408 M
Gross Proceeds

$490 M
Gross Proceeds
While FinTech IPOs resumed, recent activity levels are still lower than most other time periods
Number of US FinTech IPOs
2008–2010
Fewer IPOs due to Global Financial Crisis.
2023
First year since pre-2000 with zero US FinTech IPOs.
'23 – '25
Lowest activity since the Global Financial Crisis.
Source: FT Partners' Proprietary Database
Note: Count only includes US-listed IPOs that raised $30 million or more in gross proceeds.
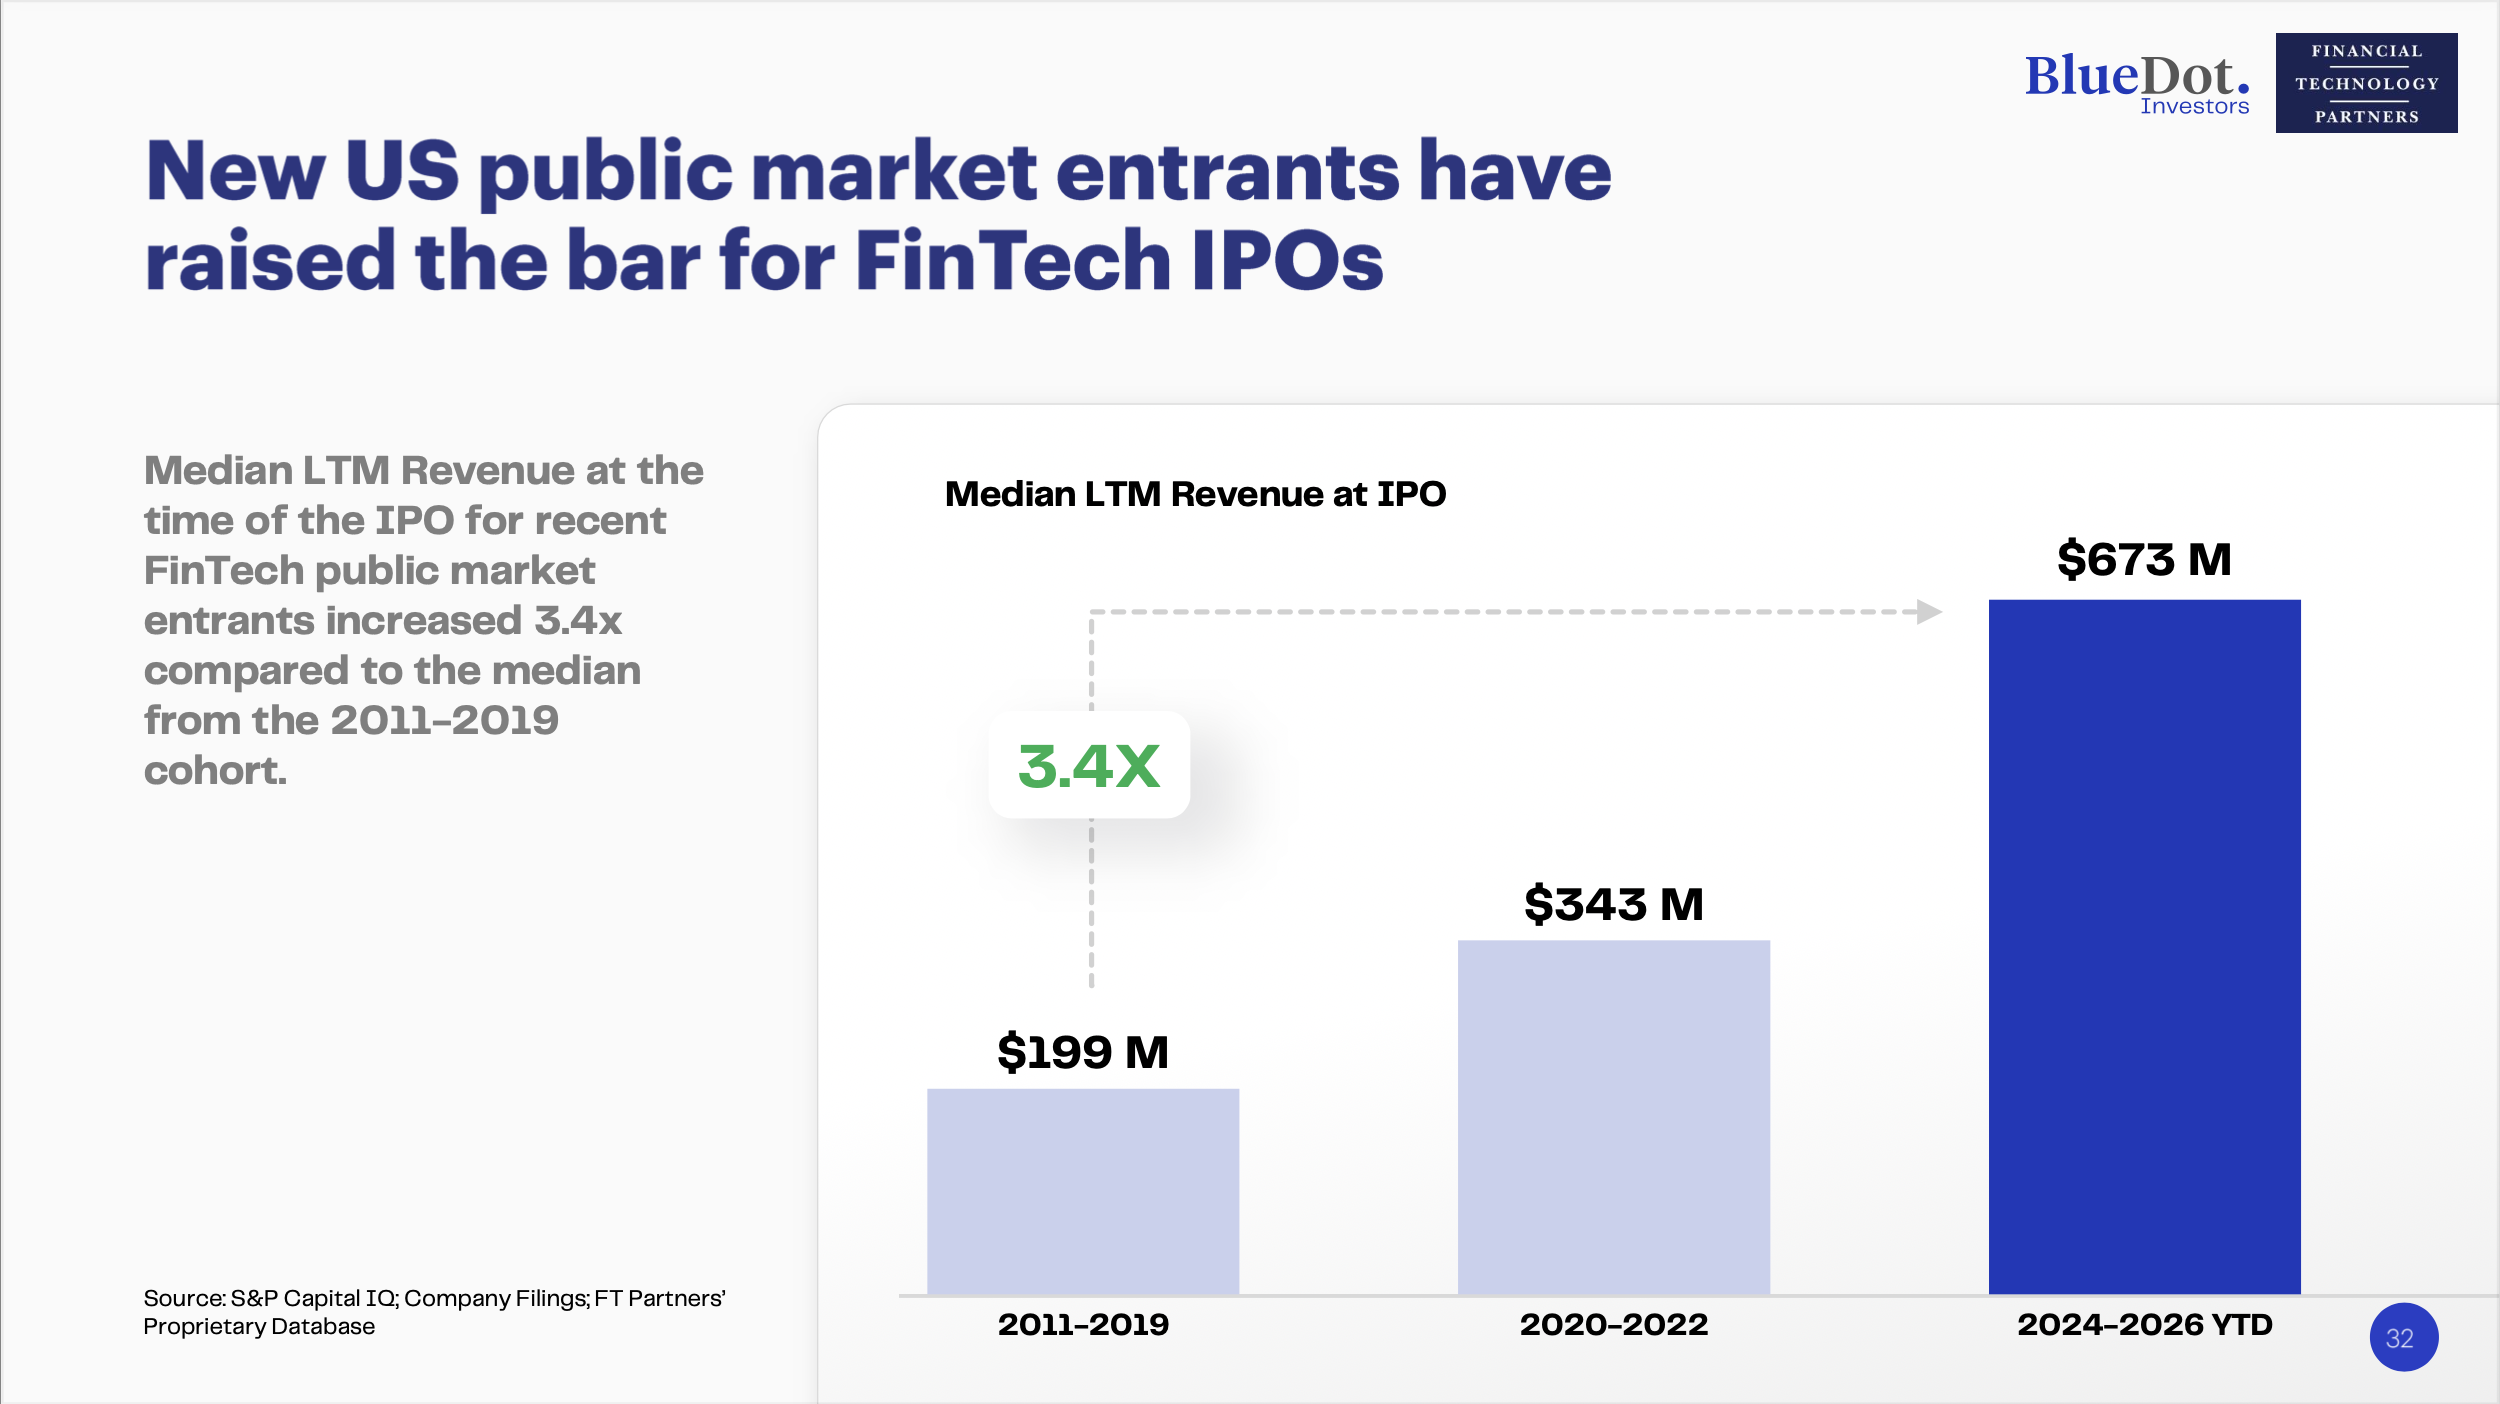
New US public market entrants have raised the bar for FinTech IPOs
Source: S&P Capital IQ; Company Filings; FT Partners' Proprietary Database
Median LTM Revenue at IPO
…And reached significantly higher revenue per employee than earlier classes
Source: S&P Capital IQ; Company Filings; FT Partners' Proprietary Database
Median LTM Revenue Per Employee at IPO
The secondary market is highly concentrated
Top 15 Private Companies (Across Industries) By LTM Executed Transaction Volume($ in M)
Source: Caplight Technologies, Inc. as of December 15, 2025
Note: 'Other' bar not to scale.
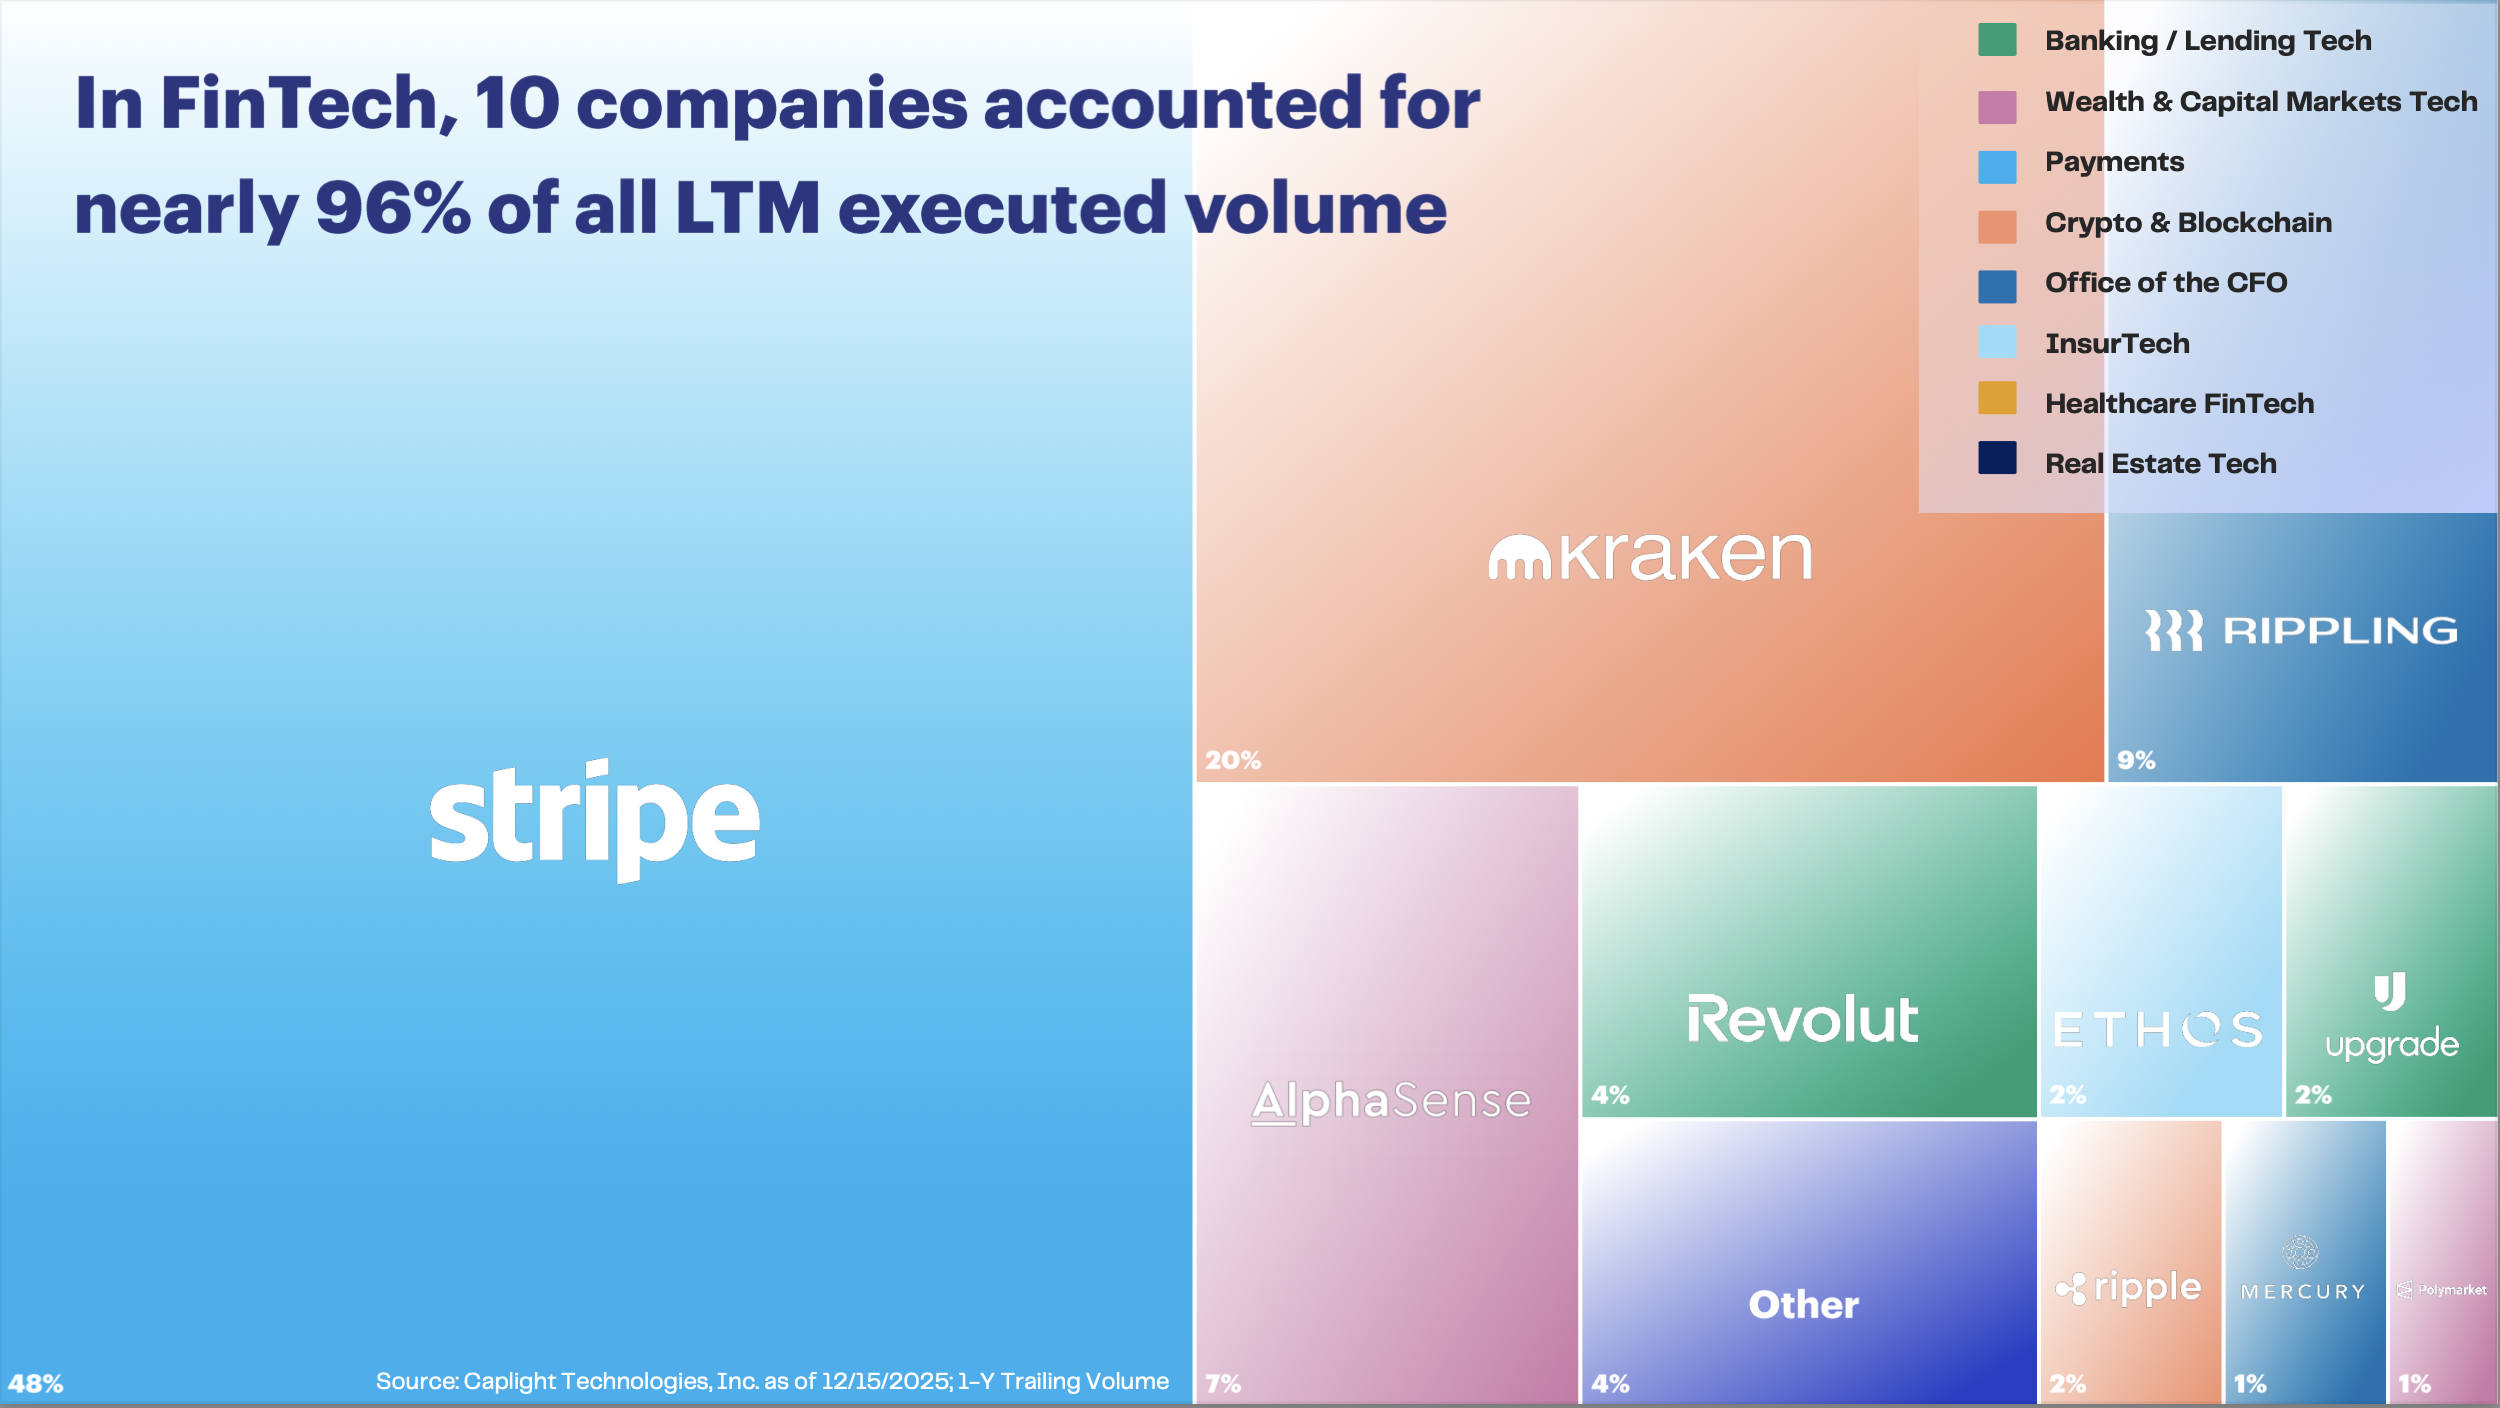
In FinTech, 10 companies accounted for nearly 96% of all LTM executed volume
FinTech-Focused Top 10 + Other – % LTM Executed Secondary Volume


Other
4%


Source: Caplight Technologies, Inc. as of December 15, 2025
FinTech secondary activity surged in 2025
FinTech secondary volume increased nearly 4x year-over-year in 2025.
Source: Caplight Technologies, Inc. as of 12/15/2025
Secondary Volume ($ in M) / Deal Count
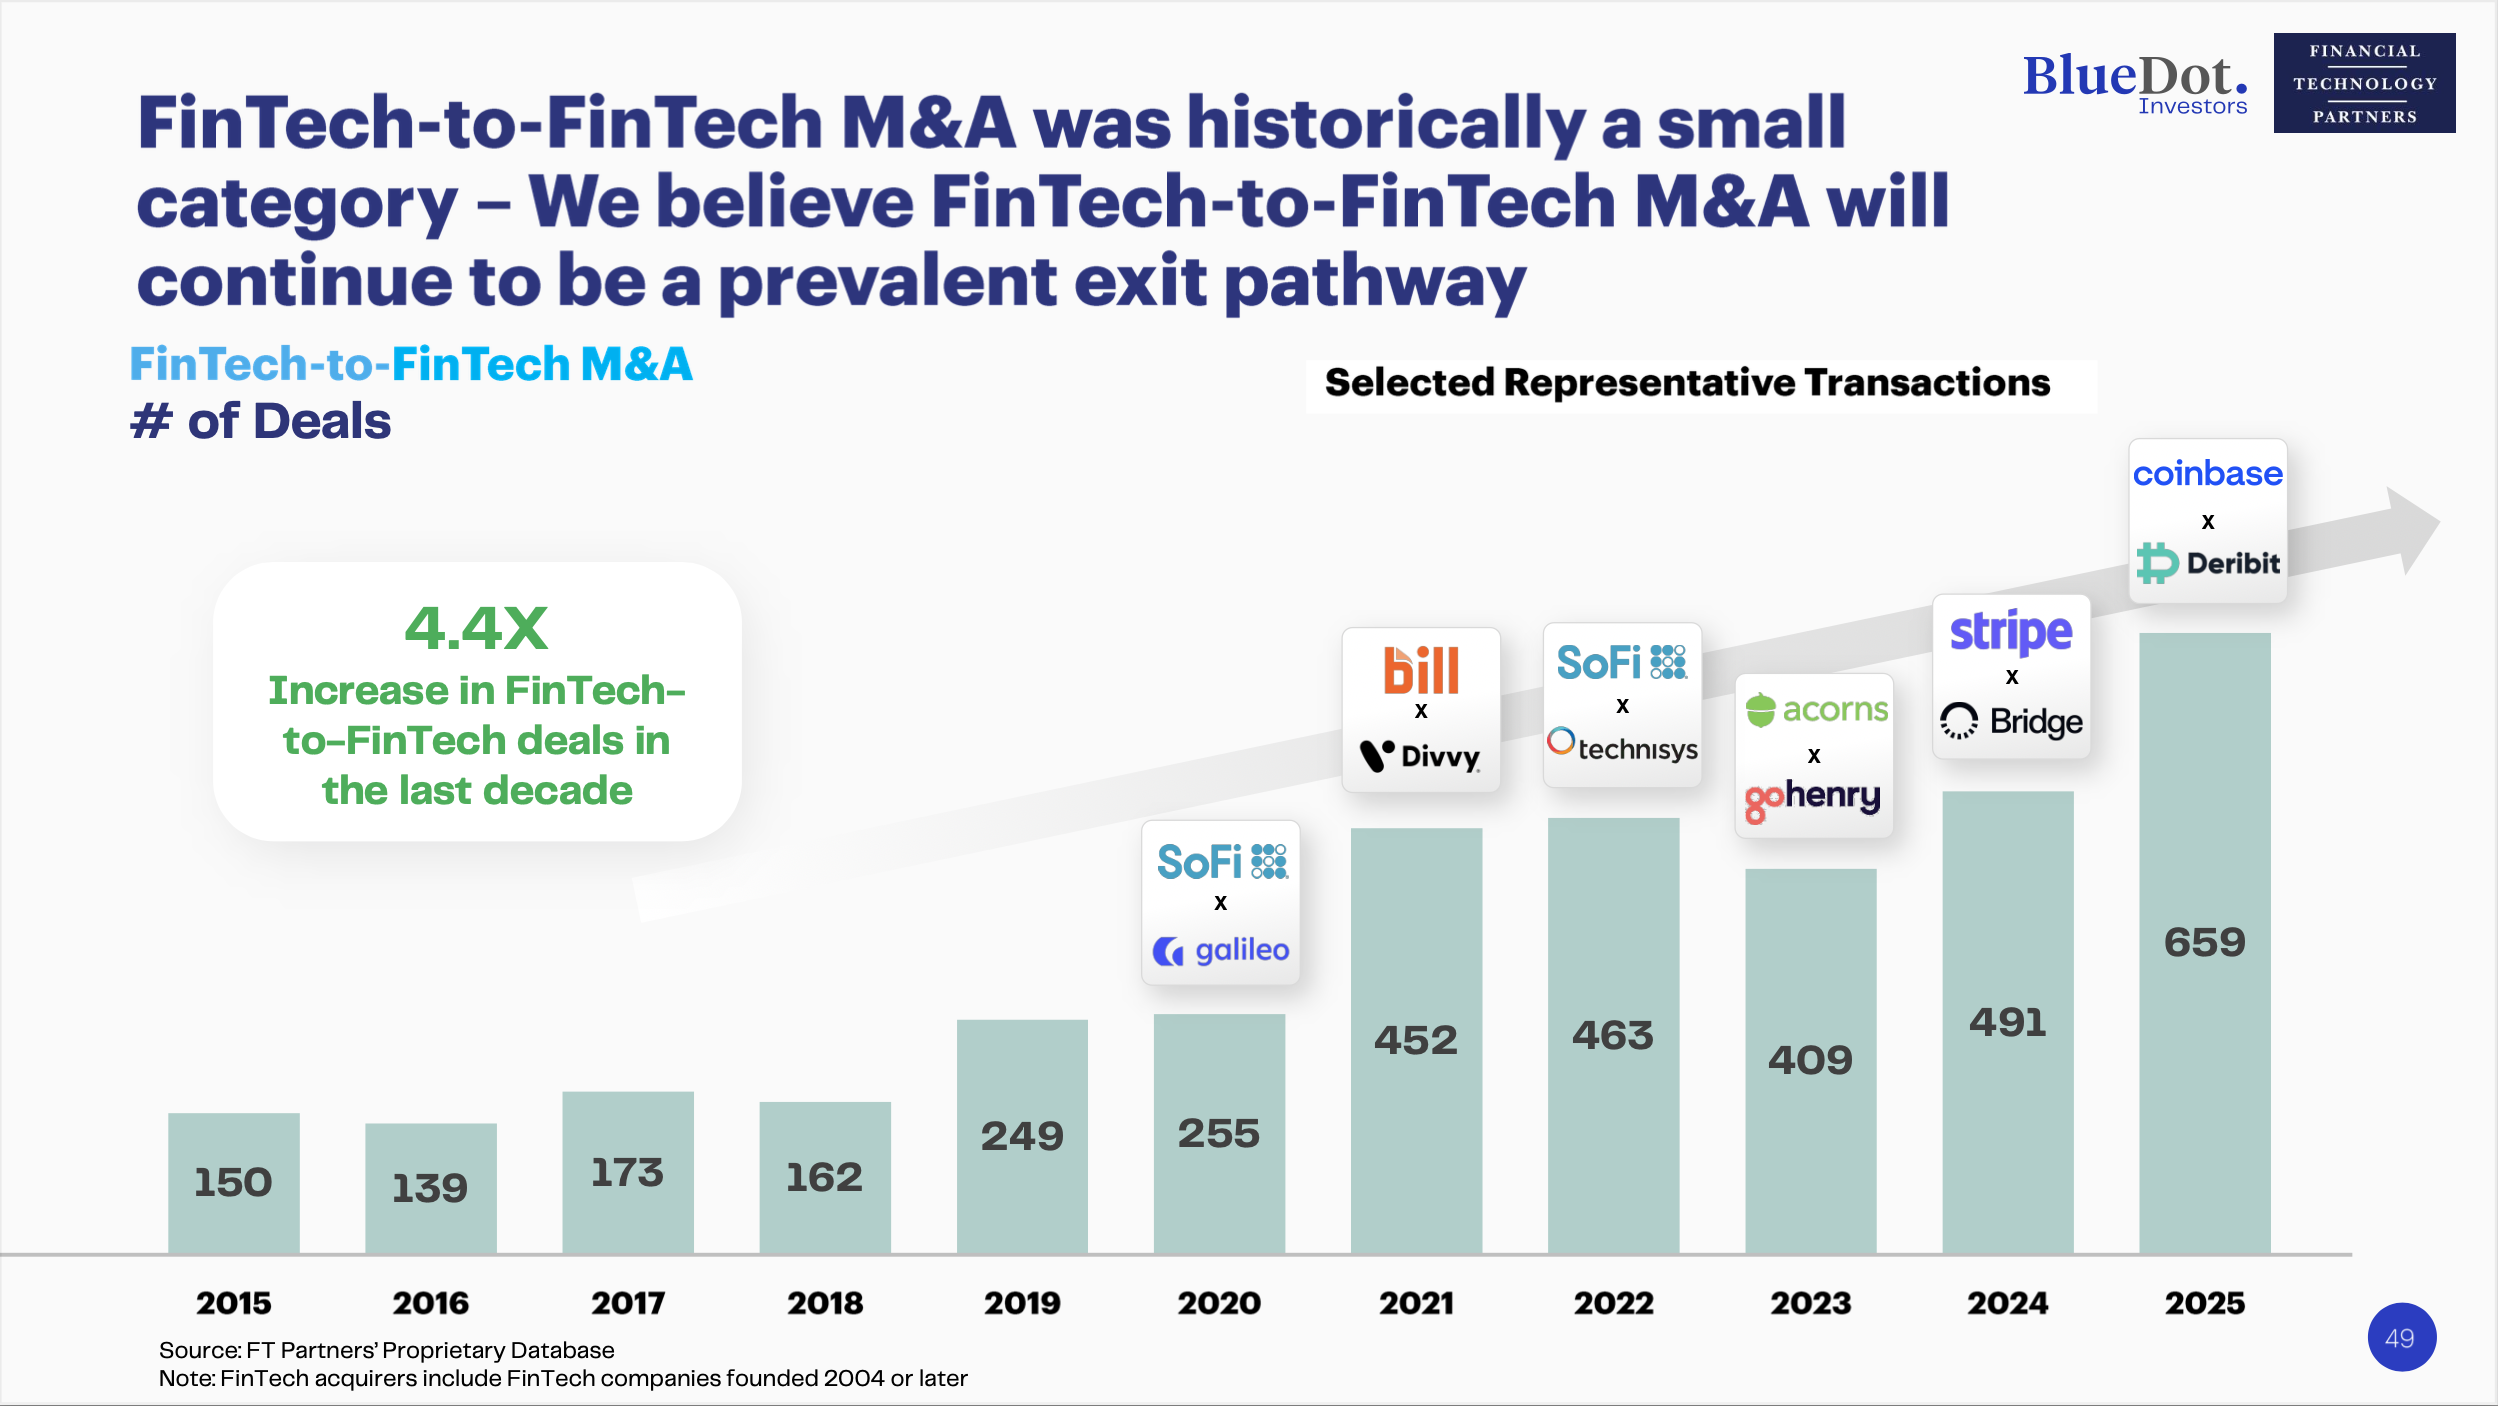
FinTech-to-FinTech M&A was historically a small category – we believe FinTech-to-FinTech M&A will continue to be a prevalent exit pathway
FinTech-to-FinTech M&A
# of Deals
Selected Representative Transactions
Source: FT Partners' Proprietary Database
Note: FinTech acquirers include FinTech companies founded 2004 or later.
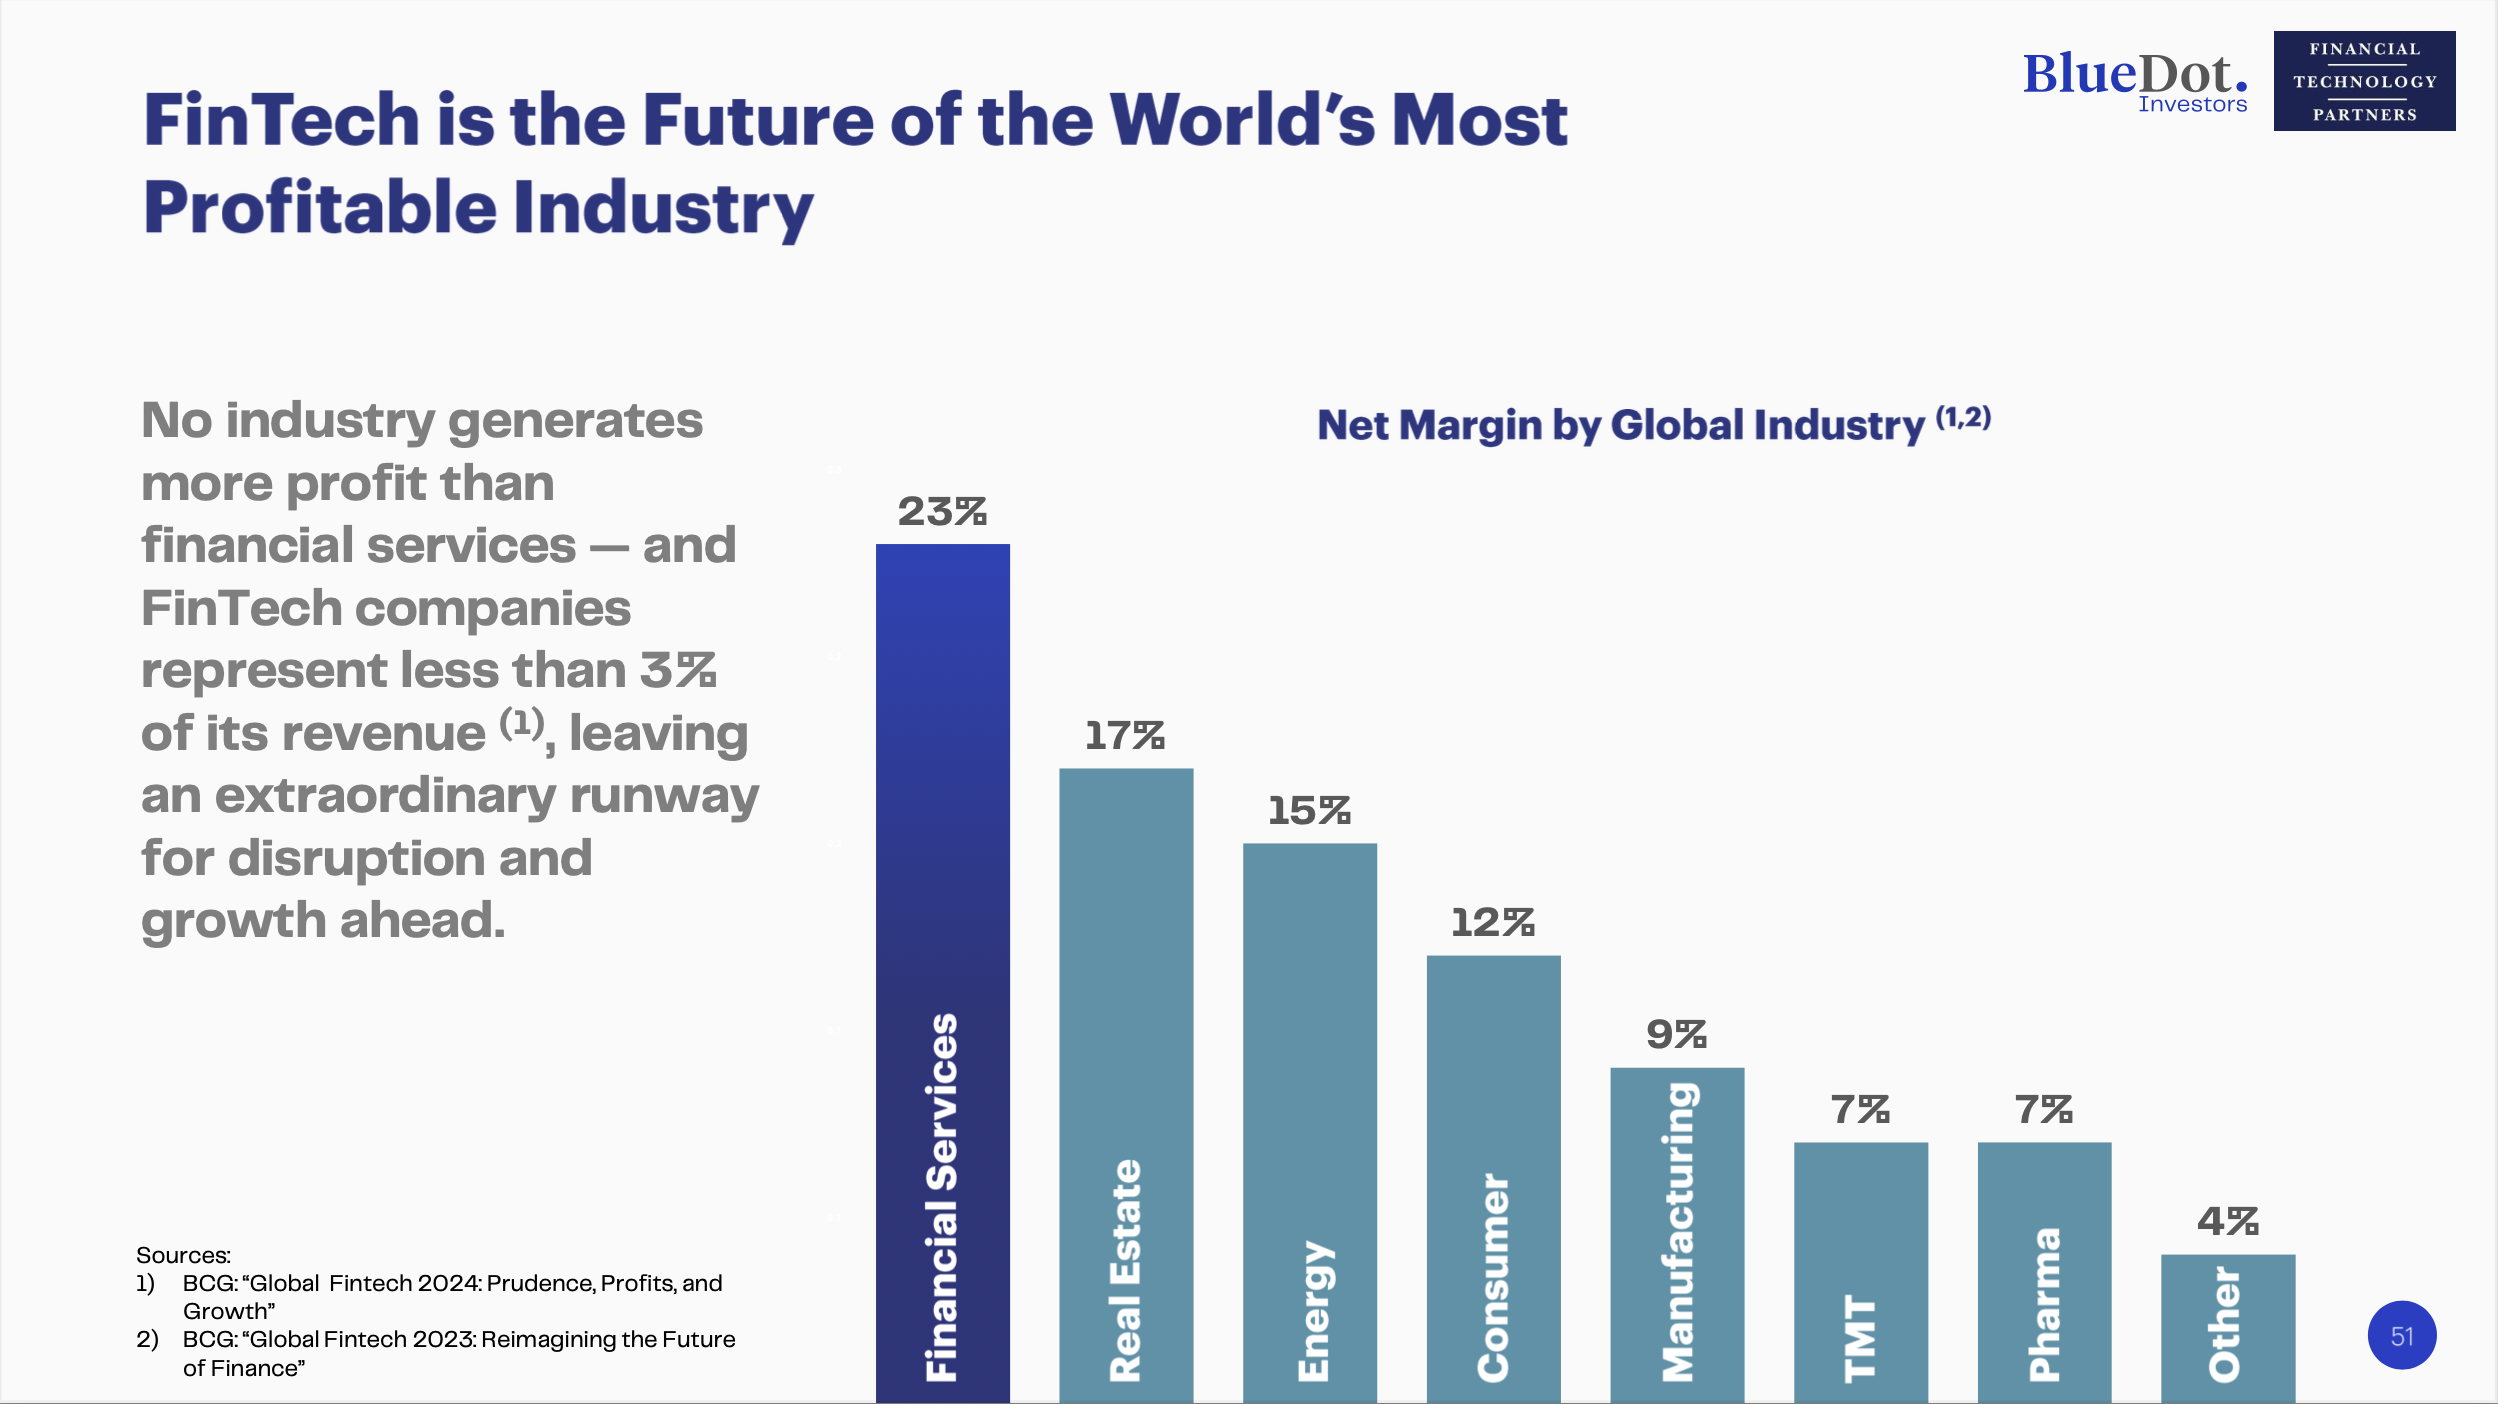
The North Star: Financial Services is The World's Most Profitable Industry
No industry generates more profit than financial services — and FinTech companies represent less than 3% of its revenue (1), leaving an extraordinary runway for disruption and growth ahead.
Sources:
1) BCG: “Global Fintech 2024: Prudence, Profits, and Growth”
2) BCG: “Global Fintech 2023: Reimagining the Future of Finance”
Net Margin by Global Industry (1,2)